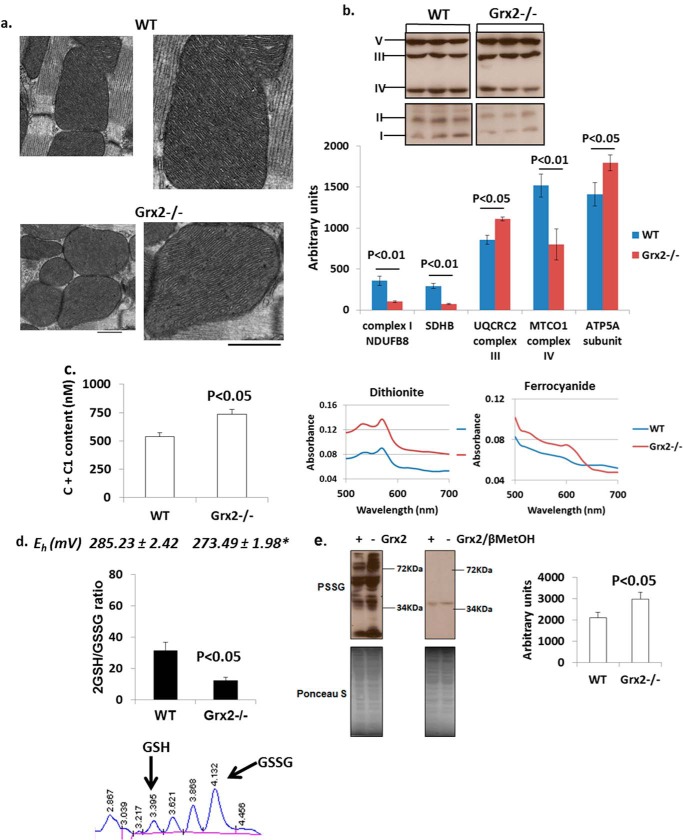
FIGURE 3.
Grx2 deficiency alters content of respiratory complexes and redox environment. a, electron microscopic images of mitochondrial cristae structure in left ventricle. Scale bar, 500 nm. n = 3. b, immunoblot analysis of respiratory complex subunits. Protein bands were identified and quantified to determine respiratory complex subunit amounts. n = 3, mean ± S.E., Student's t test. SDHB, succinate dehydrogenase B. c, absolute content of cytochromes c and c1 in cardiac mitochondria. The absolute amounts were calculated from the difference in absorbance values when mitochondria were fully reduced (dithiothreitol) or fully oxidized (ferrocyanide). n = 4, mean ± S.E., Student's t test. d, measurement of the mitochondrial 2GSH/GSSG ratio. Absolute amounts of reduced glutathione (GSH) and glutathione disulfide (GSSG) in mitochondria were measured by HPLC and then used to calculate the 2GSH/GSSG. The Eh of the ratio was then calculated using the Nernst equation. n = 4, mean ± S.E., Student's t test. * denotes p < 0.05. e, immunodetection of PSSG in cardiac mitochondria. Electrophoresis was conducted under nonreducing (left) and reducing (right; + 2% v/v βMetOH). Bands were quantified using ImageJ software. n = 4, mean ± S.E., Student's t test.

