FIGURE 1.

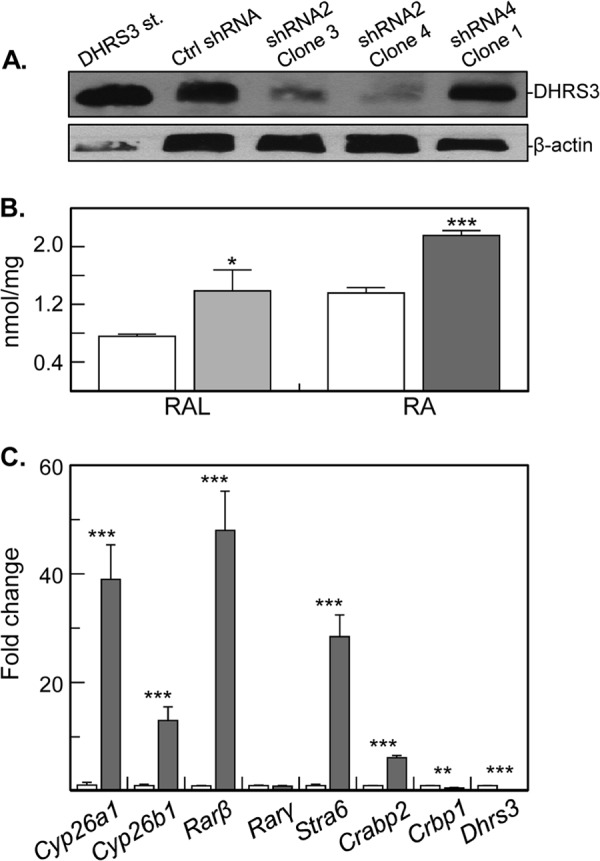
Silencing of human DHRS3 expression. A, Western blot analysis of HepG2 cells stably transfected with scrambled shRNA (Ctrl), DHRS3 shRNA 2 (clones 3 and 4), or DHRS3 shRNA4 (clone 1). Note the reduced levels of DHRS3 protein in two separate clones transfected with shRNA2, but not shRNA4. B, normal phase HPLC analysis of retinol (10 μm, overnight) metabolism to retinaldehyde (RAL) and atRA (RA) in DHRS3-silenced (shRNA2 clone 4, gray bars) versus control HepG2 cells (white bars). The results are representative of three independent experiments: *, p < 0.02. C, qPCR analysis of gene expression in DHRS3-silenced HepG2 cells (gray bars) versus control cells (white bars). ***, p < 0.001, mean ± S.E., n = 3. Two independent clones, 3 and 4, showed similar results.
