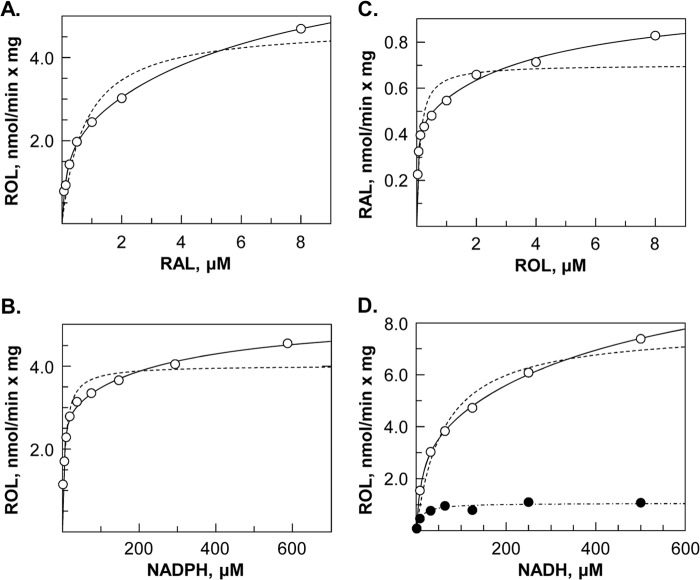
FIGURE 5.
Kinetic analysis of DHRS3 + RDH10 microsomes. DHRS3 + RDH10 microsomes were incubated with 1 mm NADPH and varied concentrations of retinaldehyde (RAL) (A); with retinaldehyde (5 μm) and varied concentrations of NADPH (B) or NADH (D); or with 1 mm NADP+ and varied concentrations of retinol (ROL) (C). Open circles represent data points obtained with DHRS3 + RDH10 microsomes. Closed circles in A represent RDH10-only microsomes; open squares, DHRS3-only microsomes; closed squares, RDH10-only microsomes plus DHRS3-only microsomes. The amount of microsomal protein in each reaction was equalized by adding microsomes from uninfected Sf9 cells. Note that simple mixing of microsomes containing each protein separately does not lead to activation of DHRS3. Closed circles in D represent data points for RDH10-only microsomes. The kinetic data were fitted to one-enzyme (dashed lines) or two-enzyme (solid lines) models. The difference in the Vmax values between RDH10 microsomes and DHRS3 + RDH10 microsomes is consistent with the activation of RDH10 by DHRS3.

