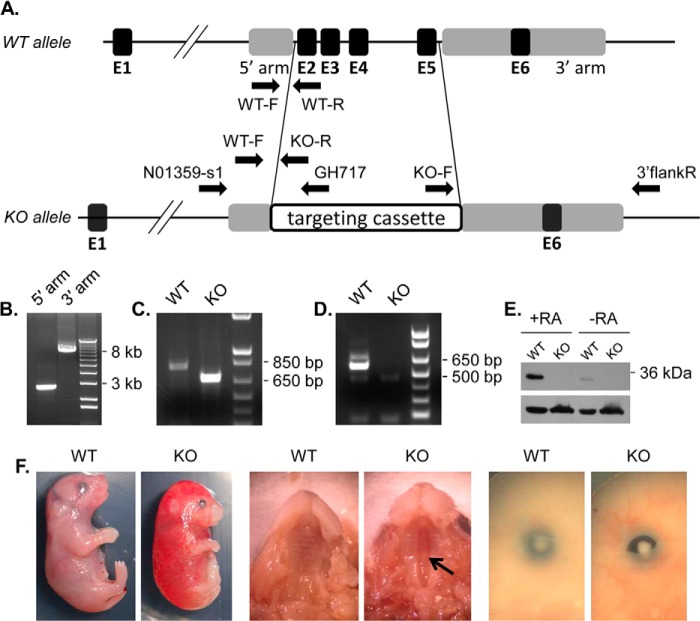
FIGURE 7.
Generation of Dhrs3−/− mice. A, a diagram showing the wild-type (WT) and knock-out (KO) Dhrs3 alleles. Exons (black boxes) are labeled E1 through E6. Targeting homology is represented by gray boxes. In the KO allele, a 6001-bp fragment, which contains coding exons E2–E5, is substituted with the 8540-bp NorCOMM targeting cassette. Arrows indicate the location and orientation of genotyping primers (WT-F, WT-R, and KO-R), and long range PCR primers (N01359-s1, GH717, KO-F, and 3′flankR). B, long range PCR amplification of the 5′ homology arm (expected size 2671 bp) and 3′ homology arm (expected size 7892 bp). C, PCR analysis of WT (primers WT-F and WT-R, product 816 bp) and KO (primers WT-F and KO-R, product 682 bp) mouse tail genomic DNA. D, RT-PCR analysis of exons 2–5 (product 587 bp) using primers mDHRS3ex2F and mDHRS3ex5R. E, Western blot analysis of E14.5 WT and KO MEFs (15 μg of 10,000 × g fraction) treated with 200 nm atRA or vehicle for 12 h using DHRS3 ProteinTech antibody or β-actin antibody (lower). F, external views of E18.5 mouse embryos. Arrow indicates clefting of the secondary palate.

