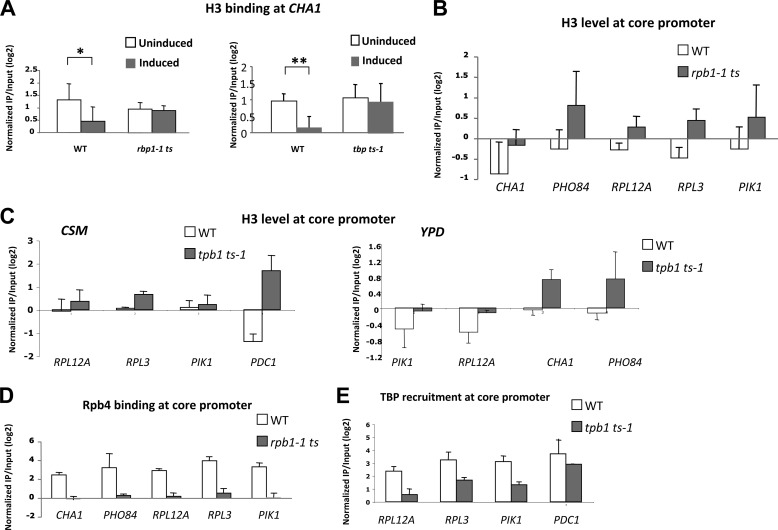
FIGURE 7.
Dependence of histone H3 association on Pol II and TBP. A, association of histone H3 with the CHA1 promoter was measured by ChIP in yeast grown in CSM without (uninduced) or with (induced) 1 mg/ml of serine and shifted to 37 °C for 1 h. Strains used were RMY521 (wild type) and Z111-Srb5-Myc (left panel), and BYΔ2 (wild type) and BYΔ2-ts1 (tbp ts-1). B, association of histone H3 with the indicated promoters was measured by ChIP for yeast grown in YPD after a 1-h shift to 37 °C in wild type (RMY521) and rpb1-1 ts (Z111-Srb5-Myc) yeast. CHA1 is partially induced in YPD medium. C, association of histone H3 with the indicated promoters was measured by ChIP in wild type (BYΔ2) and tbp ts-1 (BYΔ2-ts1) yeast grown in CSM (left panel) or YPD (right panel) medium after a 1-h shift to 37 °C. D, association of Rpb4 with the core promoter regions of the indicated genes was measured by ChIP in wild type (RMY521) and rpb1-1 ts (Z111-Srb5-Myc) yeast grown in YPD after 1 h at 37 °C. E, association of TBP with core promoter regions of the indicated genes was measured by ChIP in wild type (BYΔ2) and tbp ts-1 (BYΔ2 ts-1) yeast grown in CSM after 1 h at 37 °C. Relative association in all cases was determined by quantitative PCR analysis of input and immunoprecipitated (IP) samples, and normalized to a non-transcribed region of ChrV (25). All error bars represent S.D. (n = 3 except for C, left panel, and E, PDC1, for which n = 2); asterisk in A indicates p < 0.05 and the double asterisk indicates p < 0.01.

