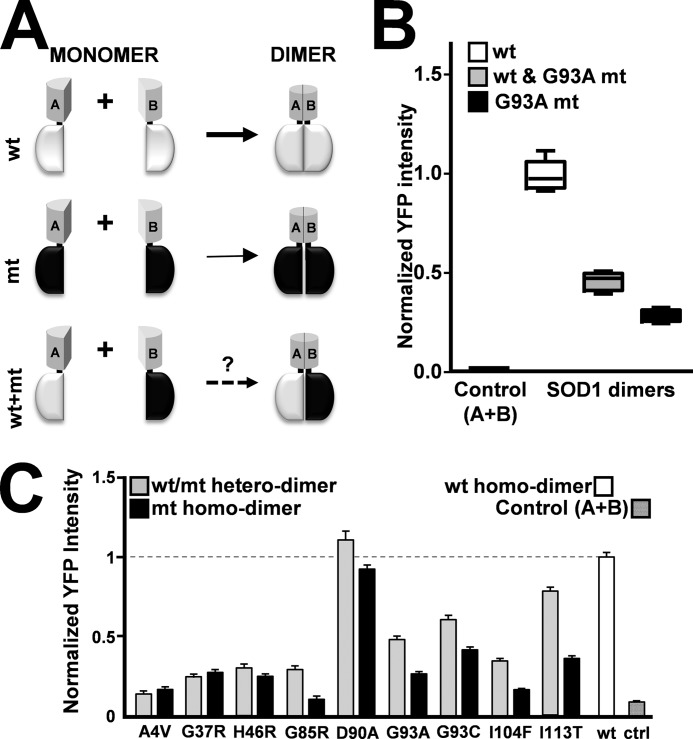
FIGURE 4.
BiFC analysis of SOD1 mutant and WT-mutant heterodimers. A, schematic of the BiFC WT and mutant combinations. B, BiFC analysis of the WT and G93A mutant homodimers and the WT/G93A mutant heterodimer (n = 3). C, histogram representation of the results obtained for the WT, mutant, and WT/mutant dimers (n = 3).

