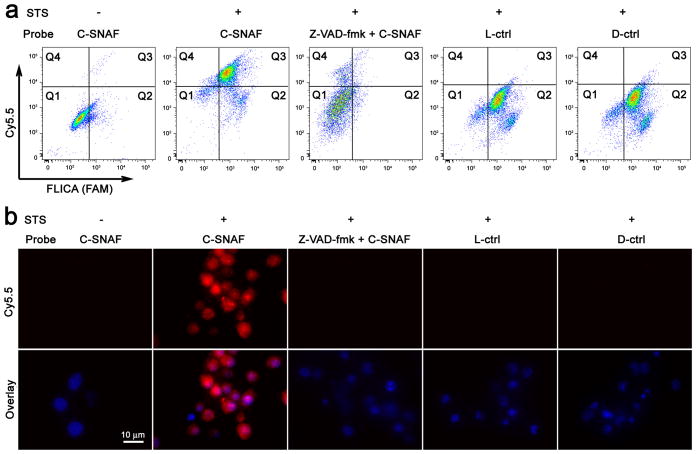
Figure 3. Imaging of caspase-3/7 activity in STS-treated cancer cells with C-SNAF.
a, Flow cytometry analysis of viable and STS-induced apoptotic HeLa cells after incubation with C-SNAF (2 μM), C-SNAF (2 μM) with caspase inhibitor Z-VAD-fmk (50 μM), or L-ctrl or D-ctrl (2 μM). The quadrants Q are defined as Q1 = fluorescent inhibitor of caspase (FLICA) negative/Cy5.5 negative, Q2 = FLICA positive/Cy5.5 negative, Q3 = FLICA positive/Cy5.5 positive and Q4 = FLICA negative/Cy5.5 positive. Representative dot plots show that FLICA-positive apoptotic cells were efficiently labeled by C-SNAF, but not by control probes (L-ctrl and D-ctrl), demonstrating a good correlation between C-SNAF and FLICA. b, Fluorescence microscopy imaging of C-SNAF (2 μM) labeling STS-induced apoptotic HeLa cells. Cells were stained with nuclear dye Hoechst 33342 (blue). Extensive fluorescence (red) was observed only in the apoptotic cells, indicating specific intracellular accumulation of C-SNAF after caspase-3/7-triggered macrocyclization and nano-aggregation.

