
Figure 4. Three-dimensional structured illumination microscopy (3D-SIM) imaging of self-assembled fluorescent nano-aggregates in cells.
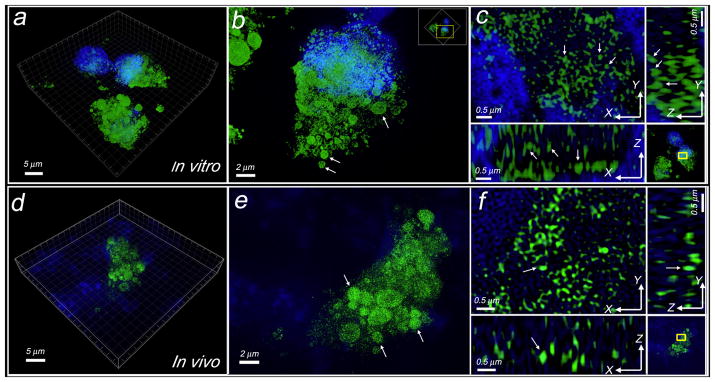
a, Representative 3D-SIM image of self-assembled fluorescent nanoparticles in apoptotic cells incubated with C-SNAF-SIM (2 μM). Cells were co-stained with DAPI (4′,6-diamidino-2-phenylindole). Green color indicates the probe fluorescence, and blue indicates nucleus. b, Enlarged 3D-SIM image of a single cell in a. Arrows show the probe accumulated in the apoptotic bodies. Yellow box indicates the enlarged area. c, Enlarged 3D-SIM images in 3D-slice in cells. Upper left shows XY slices; upper right and lower left show orthogonal YZ and XZ views of the processed Z-stack. Yellow box indicates the enlarged area. Arrows show the views of representative individual fluorescent dots in XY, YZ, and XZ panels, with a diameter of ~150 nm at X or Y dimension. d, Representative 3D-SIM image of tissue slice (10 μm thick) from DOX-treated tumor after i.v. injection of C-SNAF-SIM (20 nmol). Tissues were co-stained with DAPI. e, Enlarged 3D-SIM image in apoptotic tumor tissues from d. Arrows show the probe accumulated in the therapy-induced apoptotic bodies. f, Enlarged 3D-SIM images in 3D-slice in tumor tissues. Arrows show the same fluorescent dot observed in XY, YZ, and XZ panels.