
Figure 5. Noninvasive imaging of apoptosis in tumor-bearing mice treated with DOX.
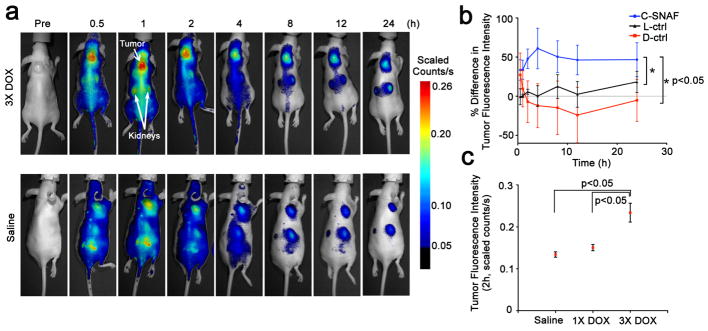
a, Longitudinal fluorescence imaging of 3X DOX- (top) and saline-treated (bottom) tumor-bearing mice with C-SNAF (5 nmol). Anatomical locations of the tumor and kidneys are indicated by white arrows. Mice bearing subcutaneous HeLa tumors received either i.v. chemotherapy of 8 mg/kg DOX or saline once every 4 days for a total of three times. Two days following the final treatment, C-SNAF (5 nmol) in saline was administered i.v. and whole-body fluorescence was monitored longitudinally using a Maestro fluorescence imager. b, The percent difference in tumor fluorescence intensity between 3X DOX and saline treatment groups over the course of imaging for C-SNAF (blue, n = 5), L-ctrl (black, n = 5), and D-ctrl (red, n = 5). * p<0.05 between groups indicates by brackets. c, A comparison of the average tumor fluorescence intensity at 2 h after C-SNAF administration in saline-treated mice (n = 4), or following a single (1X DOX) or three DOX treatments (3X DOX) in the same animals (n = 4). * p<0.05 between groups indicated by brackets. All the error bars indicate standard deviation.