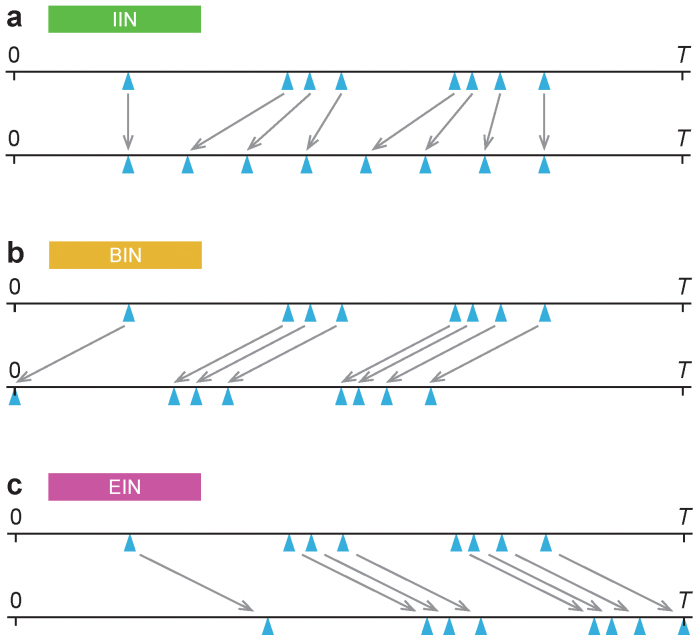
Figure 4. Illustration of the construction of reference model networks.
Like in Fig. 1, the network above is a reminder that the time lines to the right is for only one of the links. Panel a shows the time line of contacts of the highlighted link to the left. Panel b shows the same link where the interevent intervals are redistributed to the same value, thus removing the heterogeneous interevent intervals while keeping the number of contacts and the beginning and end intervals constant—the IIN reference data. Panel c shows the BIN reference data—contacts of the link with the contact sequence shifted so that the beginning interval coincides with the beginning of the sampling time. Thus the influence of the times to the first contact is destroyed. Panel d shows the dual manipulation to c where the times are moved to the end of the sampling time.

