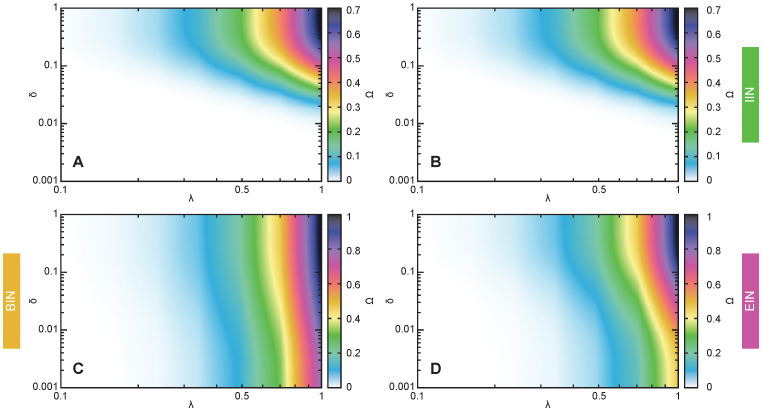
Figure 5. The average outbreak size for SIR model, an example.
We use the Prostitution data and plot the fraction of at-some-point-infected individuals as a function of the duration of the infectious state δ and the per-contact infection probability λ (for a contact between an infectious and susceptible individual). Panel a shows the values for the original network; b is for the reference network with interevent intervals of equal length (the IIN reference network); c shows values for the BIN reference network (with the first contact of each link happening simultaneously); d shows values for the EIN reference network (with the last contact of each link happening simultaneously).

