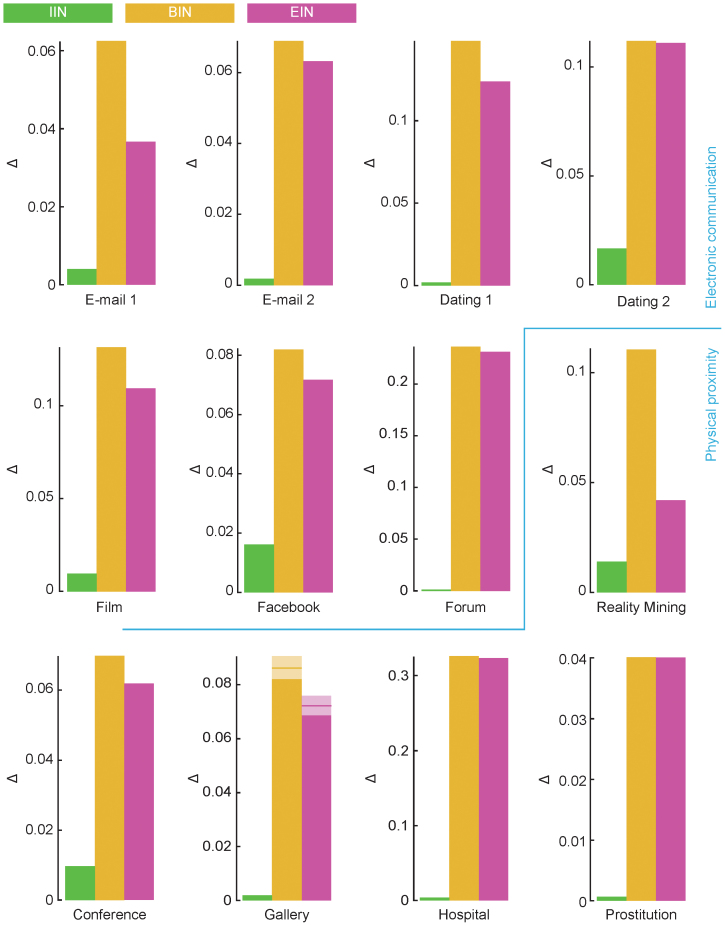
Figure 6. Deviation from the empirical outbreak sizes for the different reference data (SIR model).
This plot shows |Ωempirical(λ,δ) − Ωreference(λ,δ)| averaged over λ and δ. A large value of this quantity means that the structure that the reference model manipulated is important for disease spreading at that data set. The Gallery data are averaged over all 68 distinct data sets, the horizontal bar and shaded areas indicate the average and standard errors respectively.

