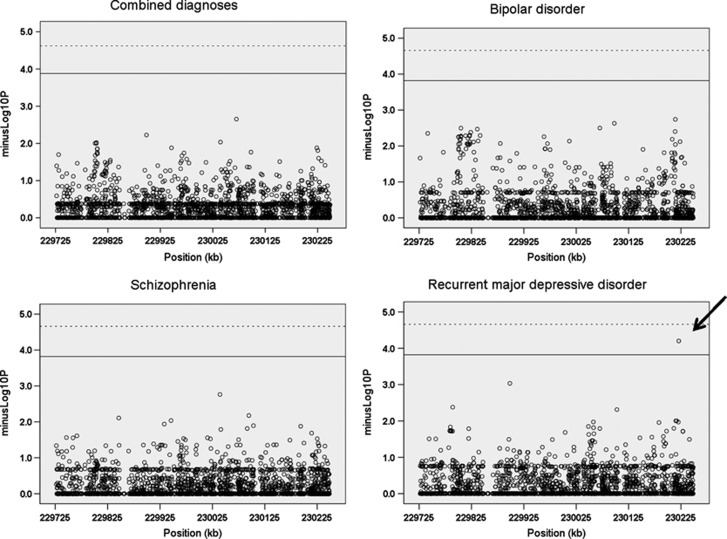
Figure 2.
Region-wide association analysis for schizophrenia, bipolar and recurrent major depressive disorder. Nominal P-values for Fisher's exact tests are plotted against genomic location (hg18) across the TRAX/DISC1 (Disrupted in schizophrenia 1) locus. Reference lines represent 1% (dashed) and 5% (solid) region-wide empirical thresholds. Only the association of rs16856199 and recurrent major depressive disorder remains significant at the 5% threshold (arrow).

