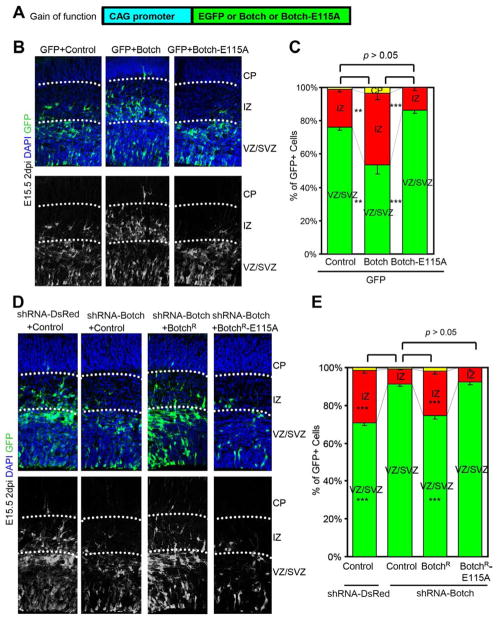
Figure 2. Botch GGCT like activity is required for regulation of embryonic neurogenesis in vivo.
(A) A schematic diagram of pCAG constructs for overexpression (gain of function) for in utero injection and electroporation.
(B–E) Distribution of GFP+ cells 2 days after in utero injection and electroporation.
(B) Representative confocal images of cortex immunostained for GFP with and without the DAPI channel with Botch expression. Abbreviations: CP, cortical plate; IZ, intermediate zone; VZ, ventricular zone; SVZ, subvetricular zone.
(C) Quantification of distribution of GFP+ cells in (B). Values represent the mean ± SEM (n ≥ 3; ** p < 0.01; *** p < 0.001; n.s. p > 0.05, one-way ANOVA, post-test: Tukey’s multiple comparison tests).
(D) Representative confocal images of cortex immunostained for GFP with and without the DAPI channel following knockdown of Botch and rescue either with BotchR or BotchR-E115A.
(E) Quantification of distribution of GFP+ cells in (D). Values represent the mean ± SEM (n ≥ 3; *** p < 0.001; n.s. p > 0.05; one-way ANOVA, post-test: Tukey’s multiple comparison test).

