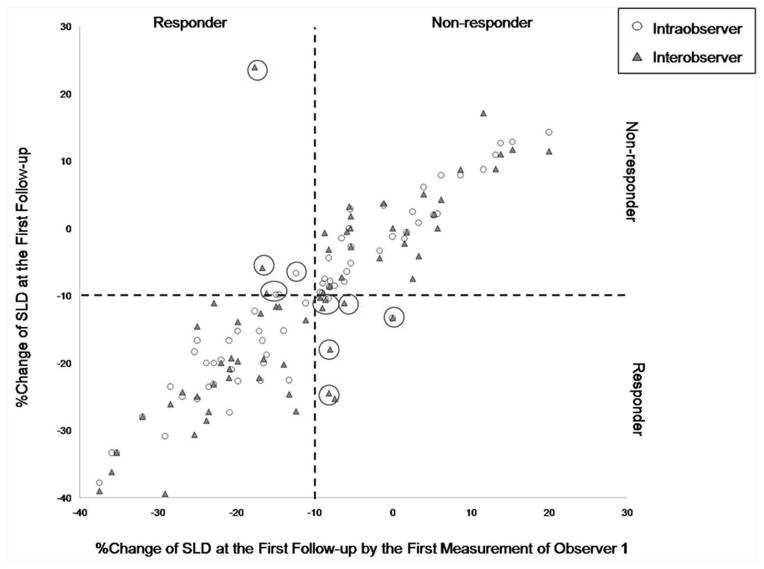
Figure 2. Scatterplot of the percent changes in SLD and response assessment using the −10% cutoff value at the first follow-up.
The second set of measurements by Radiologist 1 (circles, intraobserver) and set of measurements by Radiologist 2 (triangles, interobserver) are plotted against the percent change according to the first measurement of Radiologist 1. Dashed lines represent 10% tumor shrinkage, defining responders and non-responders. Observations in the upper left and lower right (large circles) are discordant observations. (Concordant observations obtained from two patients [−52.2%, −50.0%, −50%; 1st and 2nd measurements by Radiologist 1, measurement by Radiologist 2, respectively] and [−100% for all three measurements] are not included in the figure, since the range of axis was optimized to demonstrate observations close to −10%.).

