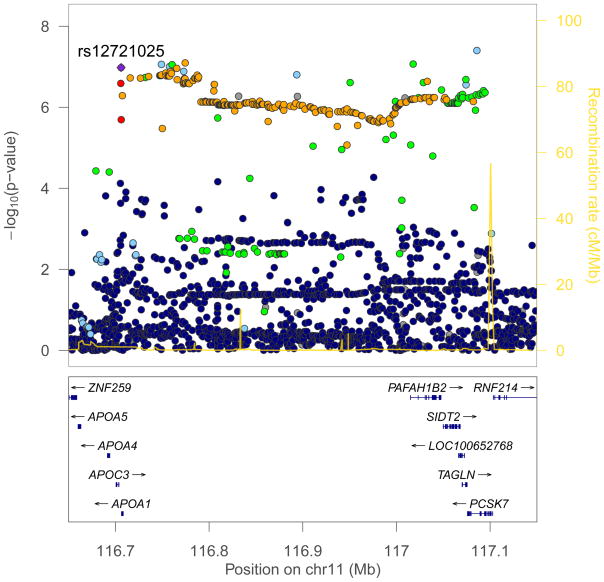
Figure 2. Regional association plot showing imputed SNP results for the novel IHPS locus on chromosome 11q23.3.
SNPs are plotted by chromosomal location (x axis) and association with IHPS (−log10 P value; y axis). The colours reflect the linkage disequilibrium of each SNP with rs12721025 (based on pairwise r2 values from the 1000 genomes project; red, r2>0.8; orange, 0.6<r2<0.8; green, 0.4<r2<0.6; light blue, 0.2<r2<0.4; purple, r2<0.2; grey, r2 data not available). Estimated recombination rates (from HapMap) are plotted to reflect the local LD structure. Genes are indicated in the lower panel of the plot. The figure was generated using LocusZoom (http://csg.sph.umich.edu/locuszoom/).

