Figure 3.
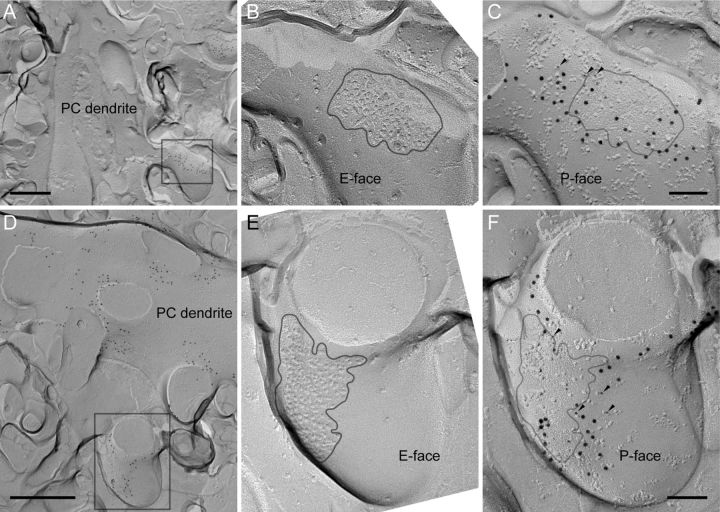
Perisynaptic localization of Cav2.1 and colocalization with mGluR1α in Purkinje cell spines. A, D, Low-magnification pictures showing spines protruding from PC dendrites. Areas in boxes are magnified in C and F. These areas show the P-face of PC spines. B, E, Corresponding locations to the boxed areas in A and D were searched on the complimentary replica. The E-face of the spines had IMP clusters indicative of excitatory postsynaptic structure. Gray lines indicate the boundaries of synapses. Note that the corresponding replicas appear as mirrored images, thus one of the pictures (showing the E-face of synapses) was flipped to allow straightforward comparison with the other (C, F, showing the P-face of the same synapse). In C and F, the boundaries of the synapse determined in the E-face replica (B, E) were projected onto the P-face. Labelings for mGluR1α (10 nm) and Cav2.1 (5 nm, arrowheads) were found colocalized near the boundary of the synapse. Scale bars: A, D, 500 nm; B, C, E, F, 100 nm.

