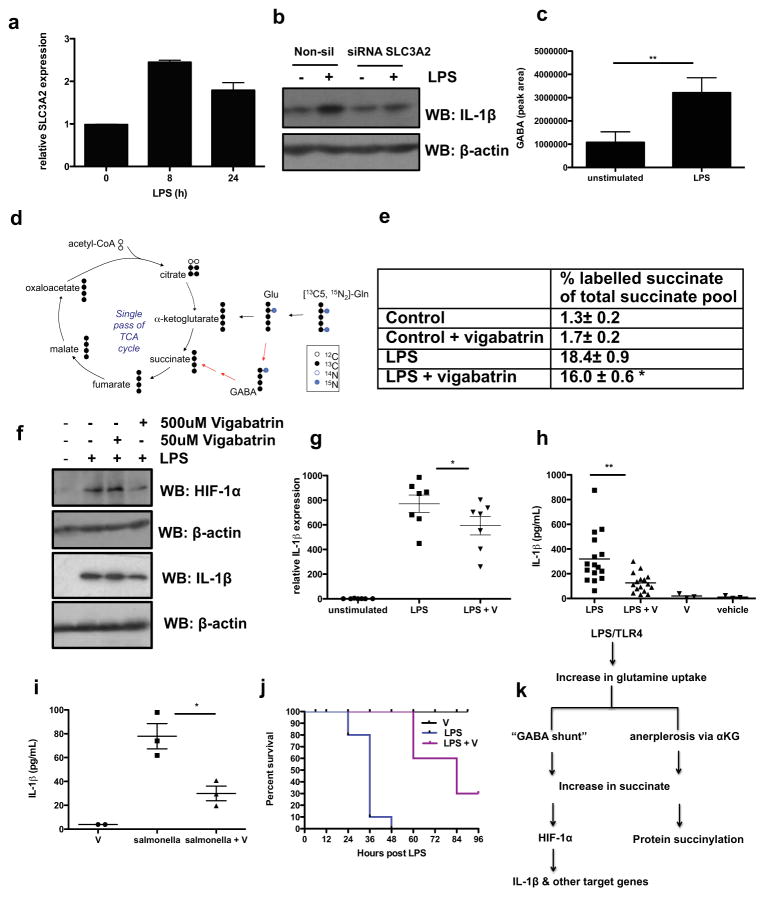
Fig. 4. Glutamine is the source of LPS-induced succinate.
(A) SLC3A2 mRNA in LPS-treated BMDMs for 8 and 24h. (B) IL-1β in human PBMCs transfected with 100nM SLC3A2 siRNA compared non-silencing control. Representative of 3 experiments. (C) GABA abundance in serum-deprived BMDMs stimulated with 10ng/ml LPS for 24h. (D) Schematic representing tracing of 13C5,15N2 labelled glutamine in BMDMs treated with LPS for 24h. (E) LPS-stimulated BMDMs pretreated ± vigabatrin (500μM) for 20h then 1mM 13C5,15N2 glutamine for 4h. Table represents ratio of 13C4-succinate to the sum of all measured succinate isotopomers as measured by LC-MS. The values shown are mean ± s.e.m, n=4. (F, G) LPS-induced HIF-1α and IL-1β protein and IL-1β mRNA (n=7) in BMDMs pretreated ± vigabatrin for 30 min. (H) IL-1β in serum from mice i.p. injected ± vigabatrin (400mg/kg) or PBS for 1.5h, then 15 mg/kg LPS or PBS solution for 1.5h (LPS n=16; LPS+vigabatrin (LPS + V) n=14; vigabatrin (V) n=3; vehicle n=3). (I) IL-1β in serum from mice i.p. injected ± vigabatrin (400mg/kg) or PBS for 1.5h then infected with 1×10⁶ Salmonella Typhimurium UK1 i.p. for 2h (J) Survival of mice i.p. injected ± vigabatrin (400mg/kg) or PBS for 1.5h, then 60 mg/kg LPS or PBS (PBS n=10 (not shown), vigabatrin n=10, LPS n=10, LPS + vigabatrin n=10). Error bars, s.e.m, * p < 0.05; ** p < 0.01. (K) Proposed model: LPS induces high levels of succinate to drive HIF-1α-dependent IL-1β expression and protein succinylation.

