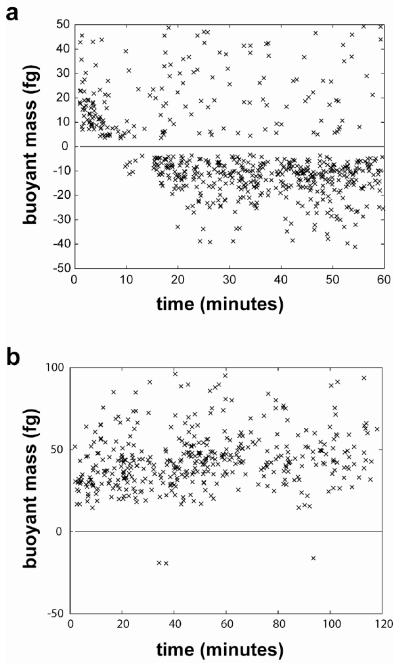
Figure 3.
The buoyant mass of E. coli cells with respect to recovery time from a hyperosmotic shock. Each data point represents a single cell or cluster transiting the cantilever. Following an osmotic shock initiated by the addition of Histodenz solution, all cells have a positive buoyant mass. As the experiment progresses, cells recover some of their lost water, decreasing in density until they have a negative buoyant mass (a). In the presence of 0.1% sodium azide (b), cells maintain a positive buoyant mass throughout the experiment.

