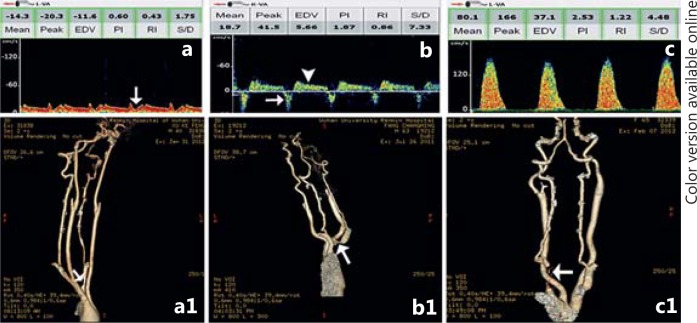
Fig. 5.
Reversed VA flow. a TCD spectra of left VA show systolic deceleration (white arrow). a1 Corresponding CTA shows mild stenosis of left subclavian artery (white arrow). b TCD spectra of right VA show reversed flow direction during the systolic period (white arrow) but normal flow direction in the diastolic period (white arrowhead). b1 Corresponding CTA shows moderate stenosis of right subclavian artery (white arrow). c Complete reversed flow direction of left VA during the whole cardiac cycle. c1 Corresponding CTA shows near occlusion of left subclavian artery (white arrow).

