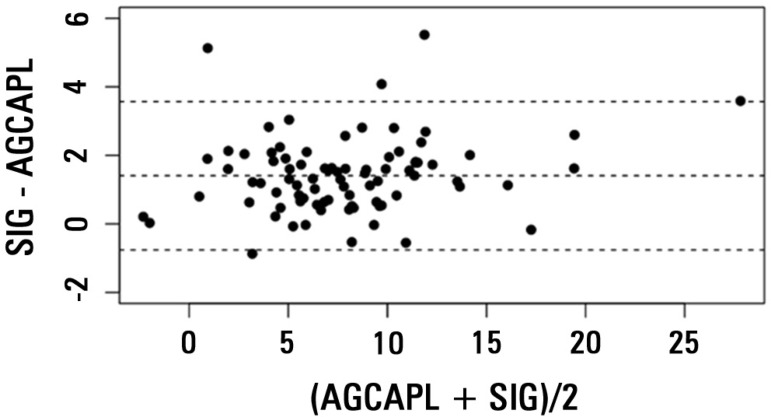
Figure 2.
Bland-Altman plot of anion gap corrected for albumin, phosphate and lactate (AGCAPL) and strong ion gap (SIG). The central dashed line represents bias (mean of SIG - AGCAPL). The other two dashed lines represent 95% limits of agreement, equivalent to 1.96 x SD of the differences (SIG - AGCAPL), equivalent to -0.75 and 3.57.

