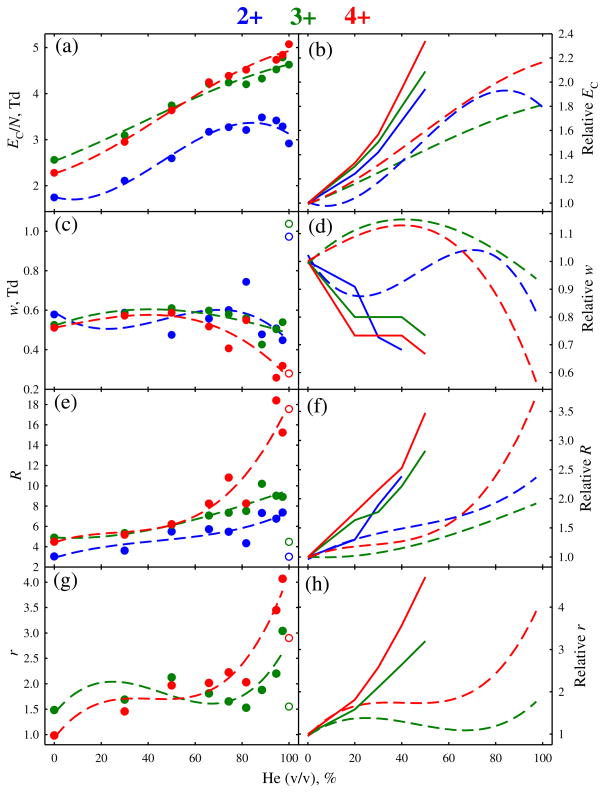
Figure 2.
Metrics of the separations in Figure 1 depending on the He fraction: normalized compensation field (a), (b), peak width (c), (d), resolving power (e), (f), and resolution of the features for 3+ and 4+ from 2+ (g), (h). Absolute quantities are in the left column, values relative to those with N2 gas are in the right column. Circles stand for the measurements, short-dash lines are cubic regressions through each dependence. The peak width and resolution data in pure He are marked by empty circles and not entered into the regressions. Solid lines (right column) are the trends (at 0–50 % He) with a planar FAIMS unit at ED = 29 kV/cm (reference [24])

