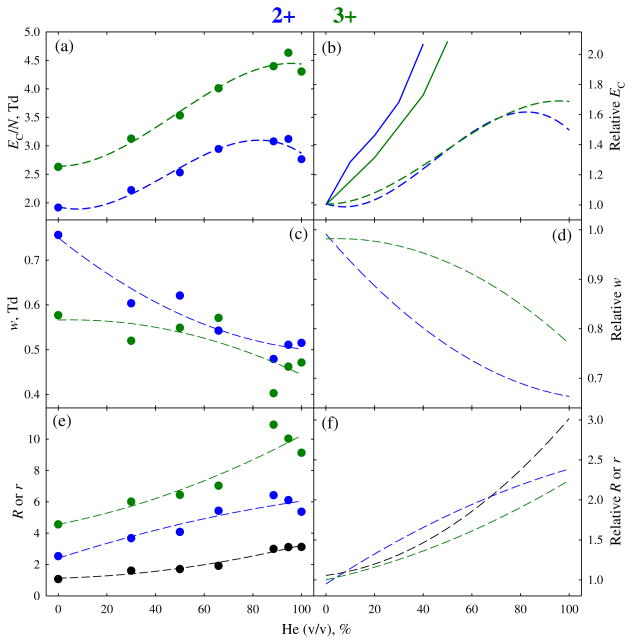
Figure 3.
Same as Figure 2 for 2+ and 3+ ions of phosphopeptide APLpSFRGSLPKSYVK (1729 Da). Here, the values for resolving power and resolution of two peaks (the latter plotted in black) are combined in (e), (f), and data with pure He are included in the regressions. The values with a planar FAIMS unit used in (b) are from reference [42]

