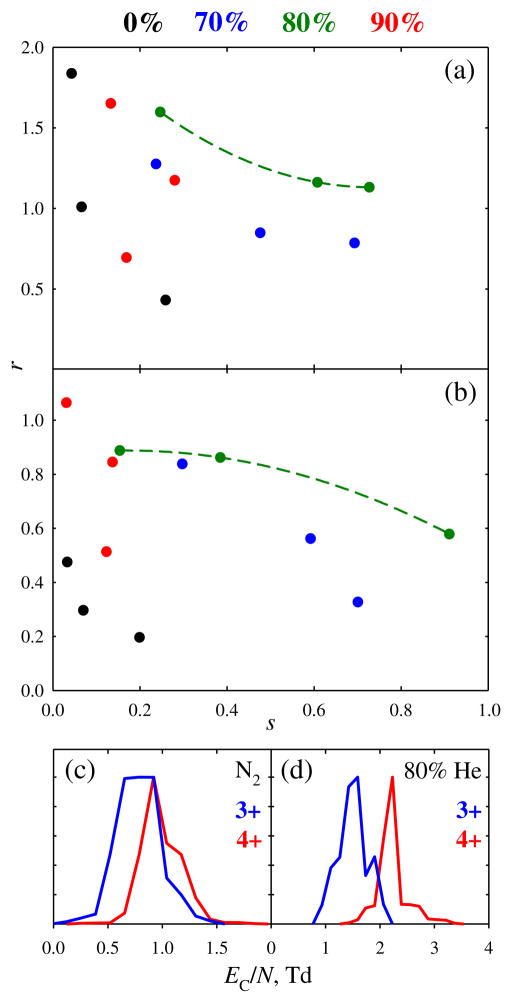
Figure 6.
Resolution/sensitivity diagrams for pairwise separations of protonated peptide ions depending on the He content (as marked): (a) melittin 3+ and 4+; (b) melittin 4+ versus neurotensin 3+. Here, “sensitivity” is signal (for the ion of lower m/z) relative to all-pass FAIMS operation (ED = 0). Quadratic regressions through the points are drawn for the optimum case of 80 % He. Bottom panels show the spectra for melittin 3+ and 4+ at 25 % ion transmission, obtained using N2 (c) and 4:1 He/N2 (d)

