Figure 10.

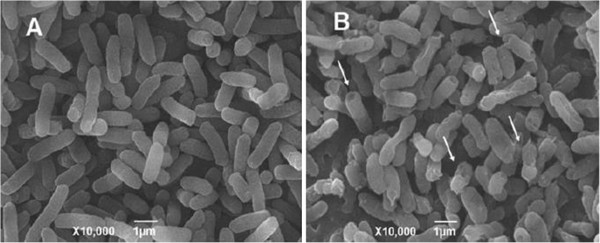
Images of E. coli taken by SEM after exposure to nano-Ag. (A) Control and (B) 1 μg mL-1 nano-Ag. Magnifications and plotting scales are marked out in each picture [193].

Images of E. coli taken by SEM after exposure to nano-Ag. (A) Control and (B) 1 μg mL-1 nano-Ag. Magnifications and plotting scales are marked out in each picture [193].