
Figure 7.
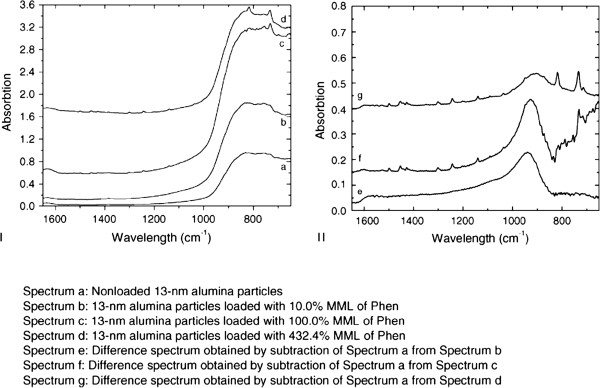
FTIR spectra. I: loaded particles (a); particles loaded with 10.0% (b), 100.0% (c) and 432.4% (d) monomolecular layer of phenanthrene. II: spectra obtained by subtraction of spectrum a from b, c and d, resulting in e, f and g, respectively. The band near 950 cm-1 is related to the surface characteristics of alumina nanoparticles [167]. The absorbance of phenanthrene can be distinguished in both spectra, f and g [146].