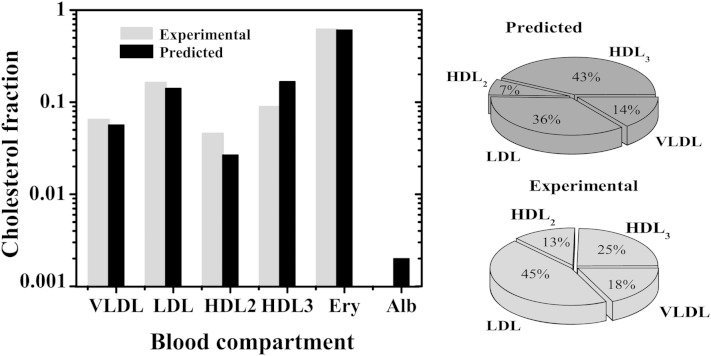
Fig. 2.
Equilibrium distribution of unesterified Chol in the various blood compartments considered in the model. Reference values in vivo (light gray bar) and equilibrium values predicted from the model using equation 7 and the parameters obtained in this work for DHE (black bar). Left panel: whole blood (a logarithm scale was used to allow comparison for all blood compartments, dominated by the Erys if a linear scale was used). Right panel: lipoprotein fraction.

