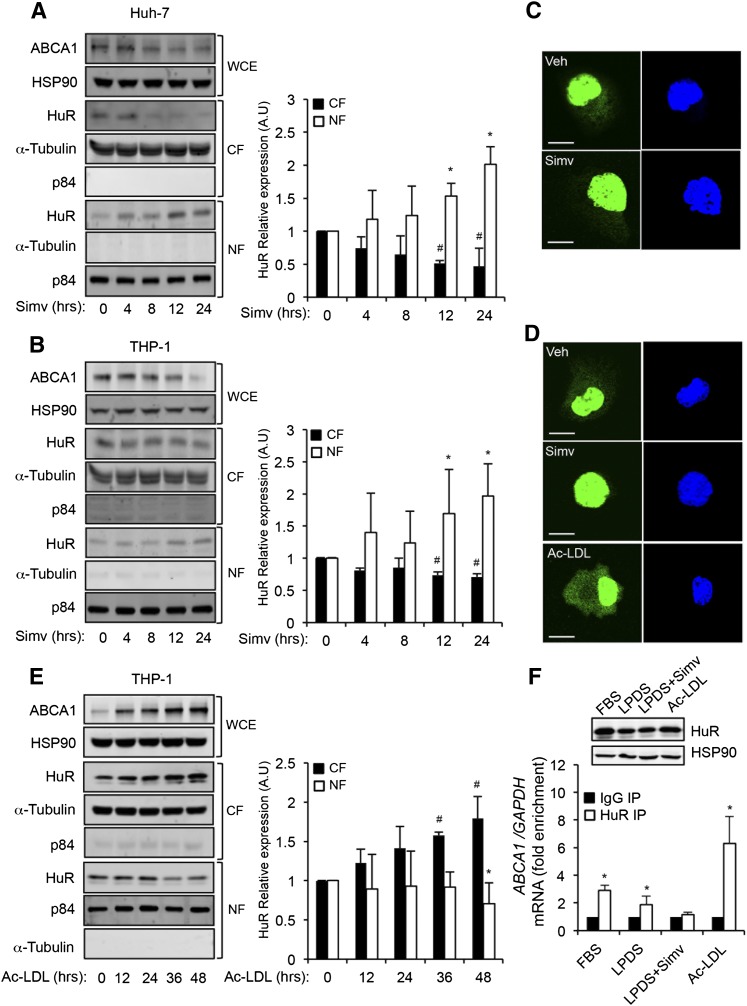
Fig. 4.
Translocation of HuR is regulated by simvastatin and Ac-LDL. A, C: Representative Western blot analysis of ABCA1, HSP90, HuR, α-tubulin, and p84 expression in Huh-7 (A) and THP-1-derived macrophages (C) treated with 5 μM of simvastatin at different time points. HuR abundance in CF (50 μg protein) and NF (10 μg protein) was analyzed. ABCA1 levels in the WCEs (50 μg protein) were measured in parallel as a control of cholesterol-depletion conditions. HSP90, α-tubulin, and p84 were used as housekeeping controls in WCE, CF, and NF, respectively. Right panels show the band densitometry analysis of the Western blots. Data are expressed as relative expression levels compared with untreated cells (time = 0 h) and normalized to 1 and correspond to the mean ± SEM of three independent experiments in triplicate. #,* P < 0.05 versus untreated group. C, D: Immunofluorescence analysis of HuR intracellular localization (green) in Huh-7 cells treated with vehicle (C, upper panel) or simvastatin (C, bottom panel) and THP-1 cells treated with vehicle (D, upper panel), simvastatin (D, middle panel), or Ac-LDL (D, bottom panel). Nuclei were stained with DAPI (blue). E: Representative Western blot analysis of ABCA1, HSP90, HuR, α -tubulin, and p84 expression in THP-1-derived macrophages treated with 120 μg/ml of Ac-LDL at different time points. HuR abundance in CF (50 μg protein) and NF (10 μg protein) was analyzed. ABCA1 levels in the WCEs (50 μg protein) were measured in parallel as a control of cholesterol-loading conditions. HSP90, α-tubulin, and p84 were used as housekeeping controls in WCE, CF, and NF, respectively. Right panels show the band densitometry analysis of the Western blots. Data are expressed as relative expression levels compared with untreated cells (time = 0 h) and normalized to 1 and correspond to the mean ± SEM of three independent experiments in triplicate. #,* P < 0.05 versus untreated group. F: RIP analysis of ABCA1 mRNA binding to HuR in Huh-7 cells cultured in presence of FBS, LPDS, LPDS with simvastatin (5 μM), or Ac-LDL (120 μg/ml). ABCA1/GAPDH mRNA ratio during RIP using anti-HuR antibody were quantified by RT-qPCR and were represented as fold enrichment compared with ABCA1/GAPDH mRNA ratio in the IgG RIP. Data are mean ± SEM of three independent experiments in triplicate. * P < 0.05 versus HuR expression was evaluated under these conditions by Western blot (F, upper panel). HSP90 expression was used as internal control of protein loading.

