Fig. 1.
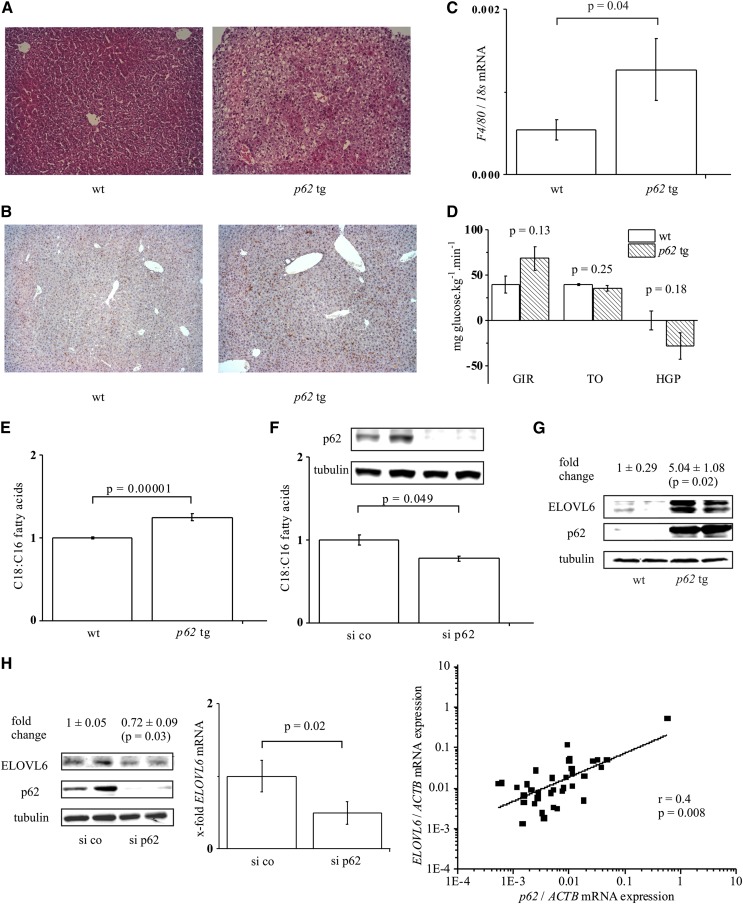
p62-Induced steatosis, C18:C16 ratio, and ELOVL6 expression. A: Hematoxylin/eosin staining of wild-type (wt) and p62 transgenic liver tissue (p62 tg) (original magnification 100×). B: F4/80 staining of wt and p62 tg liver tissue (original magnification 100×). C: F4/80 real-time RT-PCR of wild-type (wt) and p62 transgenic (p62 tg) livers (n = 13, each). D: Hyperinsulinemic euglycemic clamp study in wt (n = 3) and p62 tg (n = 4) mice: glucose infusion rate (GIR), glucose turnover (TO), and hepatic glucose production (HGP). Data show mean ± SEM. E: Hepatic C18:C16 fatty acid ratio: wt, n = 10; p62 tg, n = 19. F: C18:C16 fatty acid ratio and Western blot of the transfection control (72 h) in HepG2 cells transfected with random siRNA (si co) or p62 siRNA (si p62) (n = 3, duplicate). G: Representative ELOVL6 Western blot of wt and p62 tg mice (n = 5, each). H: ELOVL6 Western blot (n = 3, duplicate, left) and real-time RT-PCR (n = 2, triplicate, middle) of HepG2 cells transfected with si co or si p62 for ELOVL6. Right: Real-time RT-PCR for ELOVL6 and p62 of 35 liver tissues normalized on ACTB mRNA levels.

