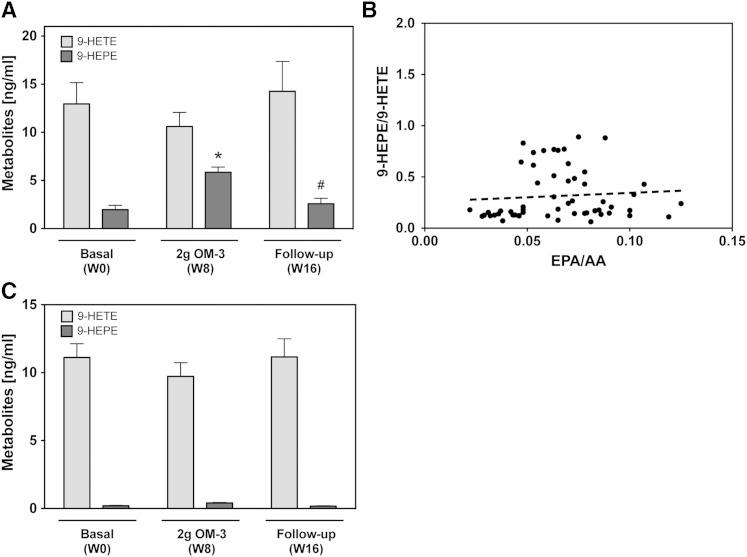
Fig. 8.
Effect of EPA/DHA supplementation on the formation of nonenzymatic oxidation products. A: Plasma levels of AA-derived 9-HETE and EPA-derived 9-HEPE at baseline [week 0 (W0)], after maximal EPA/DHA supplementation [week 8 (W8)], and after discontinuation of supplementation [week 16 (W16)]. A general linear model for repeated measurements was used for analysis (A, C) and significant changes are indicated as: *P < 0.05 versus basal level (W0) and #P < 0.05 versus maximum treatment (W8). B: Correlation of the plasma 9-HEPE/9-HETE ratio with the EPA/AA precursor ratio. Metabolite levels in (A) and (B) refer to the total amounts of 9-HETE and 9-HEPE as determined after alkaline hydrolysis. C: Presence of free 9-HETE and 9-HEPE in calcium ionophore treated blood samples.

