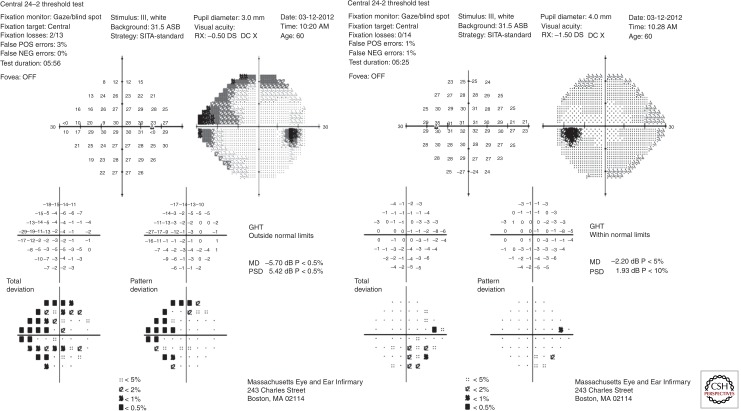
Figure 4.
A Humphrey visual field for the patient illustrated in Figure 3 shows acceptable reliability parameters in both eyes (fixation loss ≤33%; false positive and false negative rates ≤20%). Raw retinal sensitivity data in decibels (converted from an apostilb scale ranging from 0 to 10,000 candela/m2) are provided. The grayscale representation illustrates the blind spots corresponding to the optic nerves, where there are no light-sensitive cells. These raw data are compared to a normative database to generate a Total Deviation plot. For each point, the probability that the sensitivity difference versus an age-matched control is statistically different is provided. In the Pattern Deviation plot the general reduction in retinal sensitivity is factored out to yield focal defects in the visual field. The right eye shows superior and inferior nasal defects in the peripheral visual field. Interestingly the left eye, which showed structural loss, has minimal loss of visual field. Other abbreviations used: GHT, glaucoma hemifield test; MD, mean deviation; PSD, pattern standard deviation.

