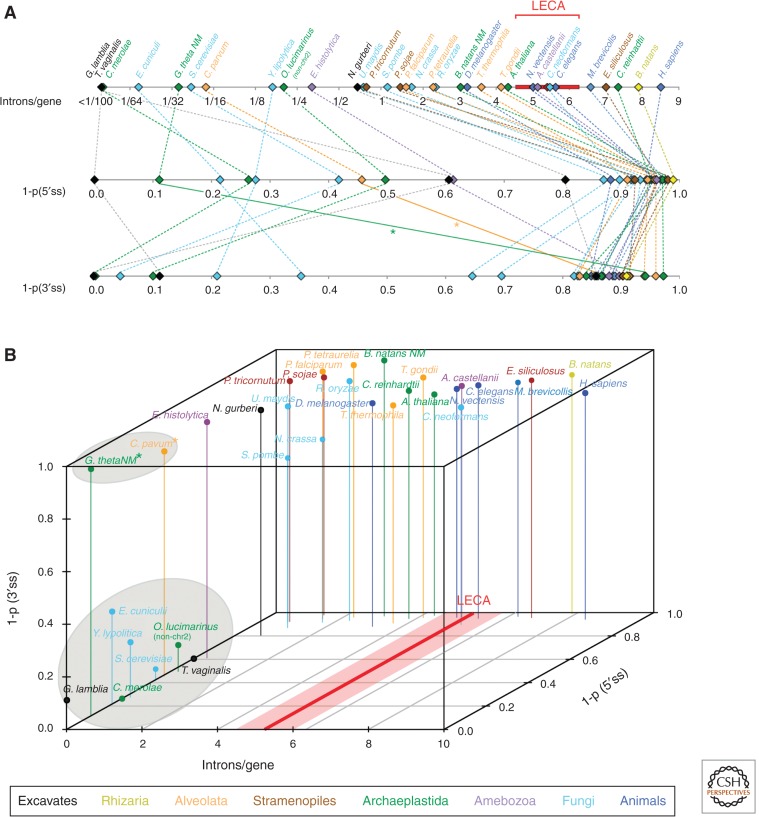
Figure 4.
Diversity of intron densities and homogeneity of splicing signals across eukaryotes. (A) Number of introns per gene (top), 1-probability (1-p) that two introns from a species share the same 5′ss (middle) or the same BP motif (bottom) for 33 species from all major eukaryotic supergroups (see color key). (B) Association between these three features: all very intron-poor species (<0.2 introns per gene) show high levels of across-intron homogeneity for 5′ss; nearly all very intron-poor species show high levels of homogeneity for BP (clusters of species inside gray ellipses). Exceptions for BP motifs (Cryptosporidium parvum and Guillardia theta NM) are indicated by asterisks. Inferred intron densities in LECA (Csurös et al. 2011) are indicated in red.

