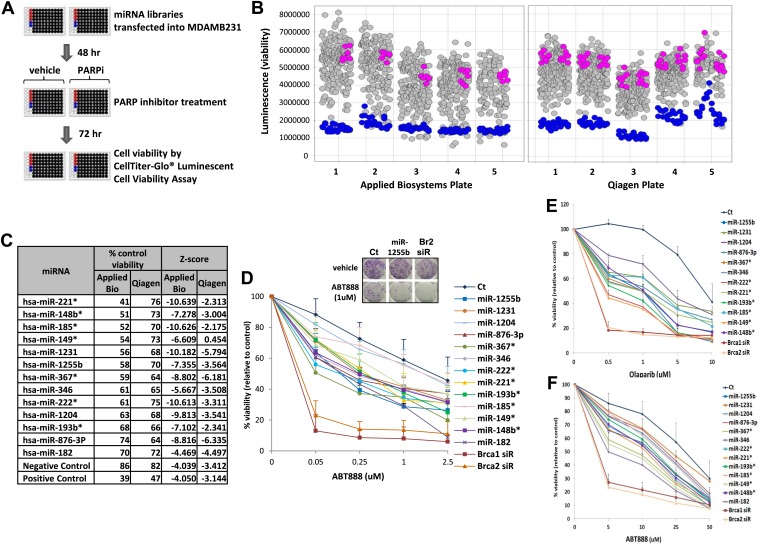
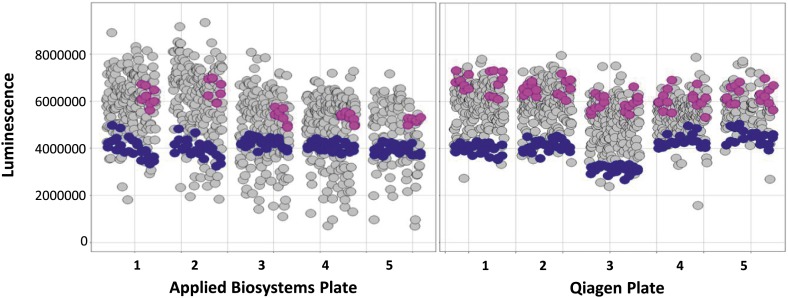
Figure 1. miRNA screen for PARP inhibitor sensitivity.
(A) Schematic of a gain-of-function screen using miRNA mimic libraries from Applied Biosystems and Qiagen to identify miRNAs that sensitize cells to the PARP inhibitor, ABT888. (B) Scatter plot (wells/plate) of luminescence (y-axis) as a read-out for viability of each miRNA-transfected well (grey circle) in the presence of ABT888 (20 µM). The plates are numbered in the x-axis. Positive control (BRCA2 siRNA, blue circles) and negative controls (control mimics, pink circles) are shown. Scatter plot for untreated samples is shown in Figure 1—figure supplement 1. (C) List of top miRNAs from the screen displayed in the order of % control viability along with Z-score. (D) Clonogenic survival assay to validate the impact of selected miRNAs on sensitivity to ABT888. MDAMB231 cells were transfected with control miRNA mimics, indicated miRNA mimics, BRCA1 siRNA, or BRCA2 siRNA and treated with vehicle or ABT888, before measuring colony formation. Curves were generated from three independent experiments and a representative image of colony formation with 1 µM ABT888 is shown in the inset. (E and F) Luminascence-based viability assay was performed in MDAMB231 cells with PARP inhibitor, olaparib (E) or in 21NT cells with ABT888 (F). Cells were transfected with control miRNA, indicated miRNA mimics, BRCA1 siRNA, or BRCA2 siRNA and treated with vehicle or PARP inhibitor before ATP quantification. Curves were generated from three independent experiments.


