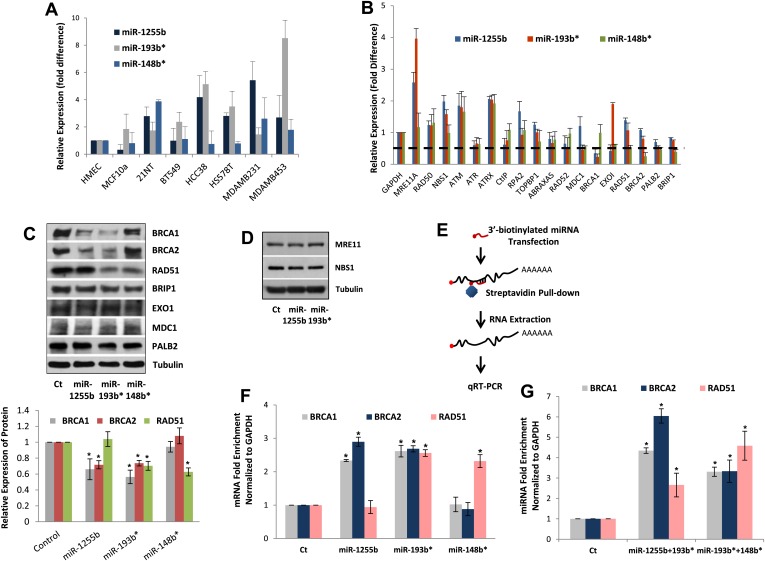
Figure 3. miR-1255b, miR-193b*, and miR-148b* regulate PARP inhibitor sensitivity by regulating expression of HR factors in TNBCs.
(A) miRNA expression profile in a panel of breast cancer lines. Endogenous expression of indicated miRNAs was quantified by qRT-PCR (normalized to 5srRNA) and represented relative to non-tumorigenic breast epithelial cell, HMEC. Expression of miR-1255b, miR-193b*, and miR-148b* were detected in these lines. Mean ± SD of four independent experiments is shown. (B–D) Expression of DDR genes is impacted by miR-1255b, miR-193b*, and miR-148b*. MDA-MB231 cells were transfected with control mimic or mimics for miR-1255b, miR-193b*, and miR-148b* and mRNA levels of predicted and prioritized DDR genes were analyzed by qRT-PCR using gene-specific primers and normalized to GAPDH. Mean ± SD of three independent experiments is shown (B). (C and D) Cell lysates were then analyzed by immunoblot for factors which had ≥50% reduction in mRNA in cells transfected with miR-1255b, miR-193b*, and miR-148b*. Images were quantified by ImageJ software and the mean ± SD of three independent experiments is graphically shown, * indicates p<0.05. (E–G) Interaction of target transcripts with miR-1255b, miR-193b*, and miR-148b*. MDA-MB231 cells were transfected with biotinylated-control mimics or biotinylated mimics for miR-1255b, miR-193b*, and miR-148b* as a single (F) or a combination (G). The immunoprecipitated RNA was analyzed by qRT-PCR using gene-specific primers and normalized to GAPDH. Mean ± SD of three independent experiments is shown and statistical significance of enrichment of specific gene transcripts is indicated by * (p<0.05). The principle steps of the method are illustrated in Figure 3E.
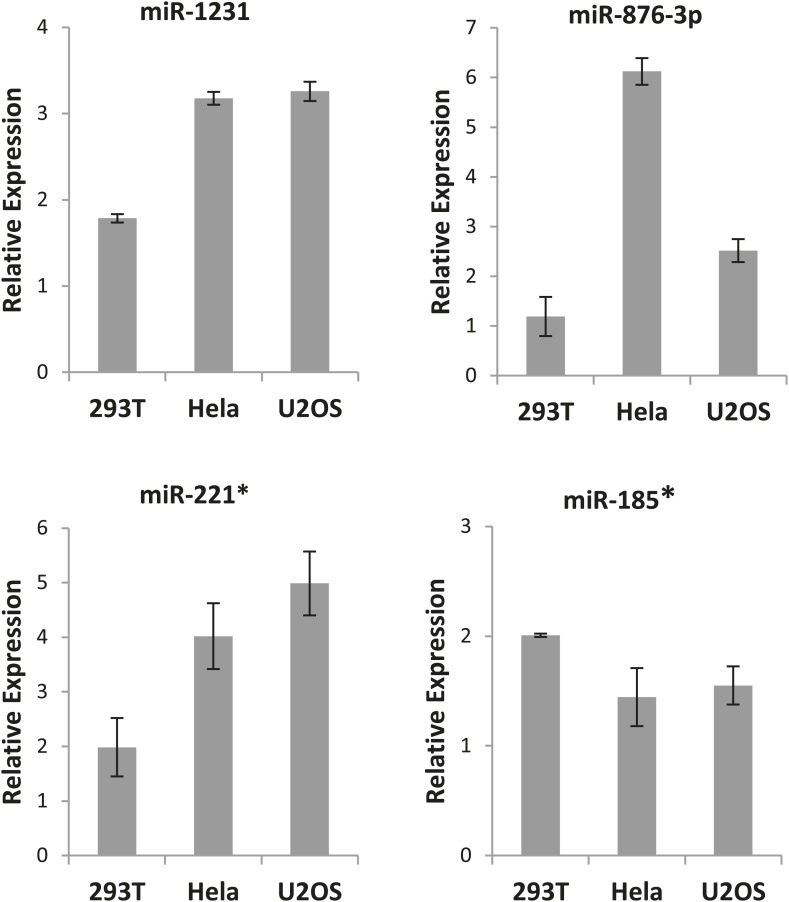
Figure 3—figure supplement 1. Expression of the excluded miRNAs.
Figure 3—figure supplement 2. The effect of miRNAs on cell cycle.


