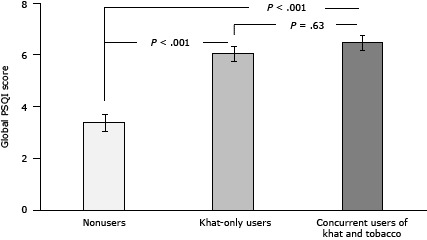
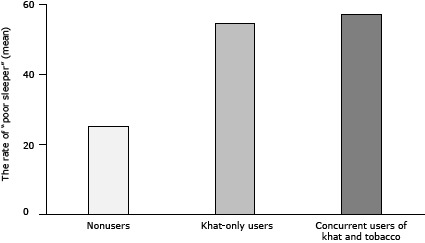
Figure 2.


Differences in subjective sleep quality as a function of khat and tobacco use status. Sleep quality measured using the Pittsburgh Sleep Quality Index (PSQI) (20). In Figure 2a, values are the mean, and the I-beam lines in each bar indicate standard error of the mean. In Figure 2b, entries show percentages of participants classified as poor sleepers as determined by global PSQI scores greater than 5. Abbreviation: PSQI, Pittsburgh Sleep Quality Index.
| Characteristic | Nonusers | Khat-Only Users | Concurrent Users of Khat and Tobacco |
|---|---|---|---|
| Global PSQI score, mean (standard error of the mean) | 3.38 (0.33) | 5.99 (0.29) | 6.45 (0.27) |
| Poor sleepers, % | 25.0 | 54.6 | 57.0 |
