Fig. 5.
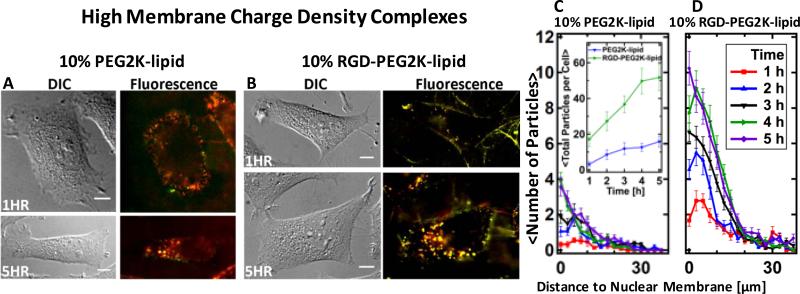
Live-cell imaging results for CL–DNA nanoparticles at high membrane charge density (DOTAP/DOPC/PEG-lipid=80/10/10, mol/mol/mol). (A,B) Representative differential interference contrast and merged fluorescence micrographs (DNA label: green; lipid label: red). At this membrane charge density, CL–DNA nanoparticles formed using PEG2K-lipid (A) attach to cells and are internalized. For RGD-tagged CL–DNA nanoparticles (B), the extent of cell attachment and uptake is even higher. (C, D) Spatial distributions of intracellular particles at various time points after incubation of cells with CL–DNA nanoparticles, determined using exogenous DNA fluorescence. Each curve represents an average over ≈20 cells. The inset in (C) shows the average total particle count per cell as a function of time. Both types of particles are taken up and accumulate in the perinuclear region of the cell, but many more RGD-tagged particles are taken up per cell and their uptake is faster. The difference in total uptake between NPs with and without RGD was statistically significant (P < 0.05). All scale bars represent 10 μm.

