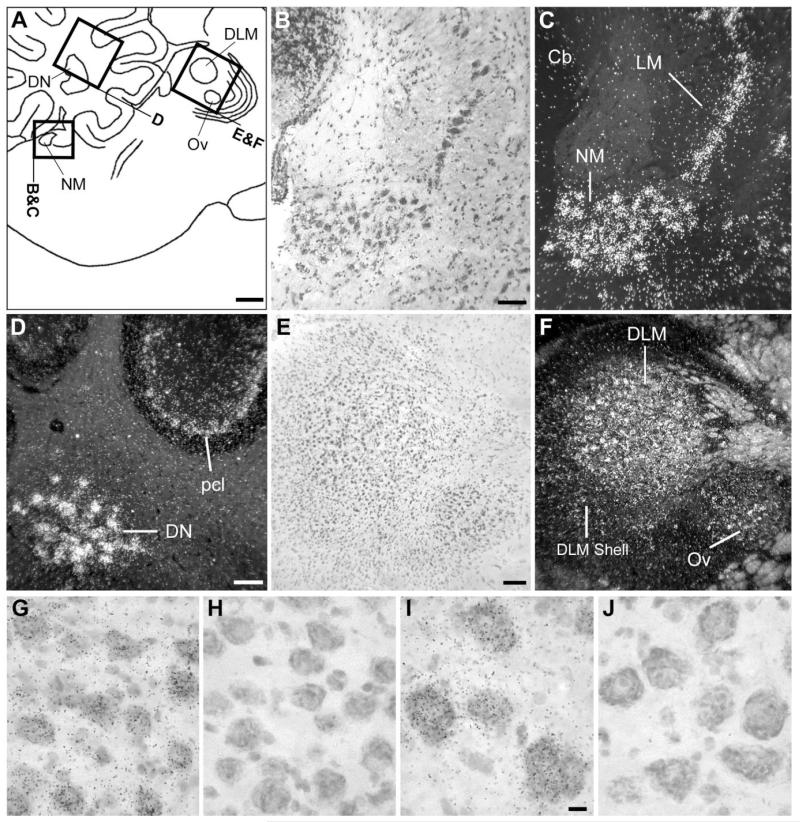
Fig. 5.
NF-M expression in the cochlear nucleus, thalamus, and cerebellum. A: Camera lucida drawing depicting the regions in the medial pons, cerebellum, and thalamus (indicated by rectangles) shown in B–F. B,C: Brightfield view of Nissl staining and darkfield view of emulsion autoradiography depicting cochlear nucleus NM and its target NL. D: Darkfield view of emulsion autoradiography depicting cerebellar structures. E,F: Brightfield view of Nissl staining and darkfield view of emulsion autoradiography depicting thalamic nuclei DLM and Ov. G-J: High-magnification brightfield view of emulsion autoradiography depicting high expression levels in the large neuronal cells within the cochlear nucleus NM and the deep cerebellar nuclei (DN) in sections hybridized with the antisense riboprobe (G and I, respectively) and the lack of hybridization signal of the sense riboprobe in these same nuclei (H and J). In A, dorsal is upward and rostral is to the right. For abbreviations see list. Scale bars = 1 mm in A; 100 μm in B,D,E (apply to B–F); 10 μm in I (applies to G–J).

