Fig. 6.
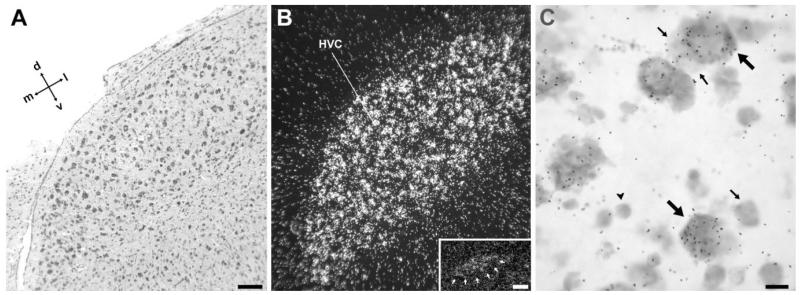
NF-M expression in song nucleus HVC. A: Detail brightfield view of a Nissl-stained frontal section through HVC, about the same level as in Figure 3A. B: Darkfield view of emulsion autoradiography at the same level as in A. Inset: Darkfield view of emulsion autoradiography of a medial parasagittal section at about 0.8 mm from the midline, showing expression in the para-HVC region. C: High-magnification view of labeled cells in HVC. Large arrows point to examples of large neuronal cells showing high NF-M expression levels; small arrows point to small neurons showing low or no expression; arrowhead depicts a glial-like cell lacking expression. For orientation see arrows in A. For the inset in B, dorsal is upward and rostral to the right. Scale bars = 100 μm in A (applies to A,B); 100 μm in inset; 10 μm in C.

