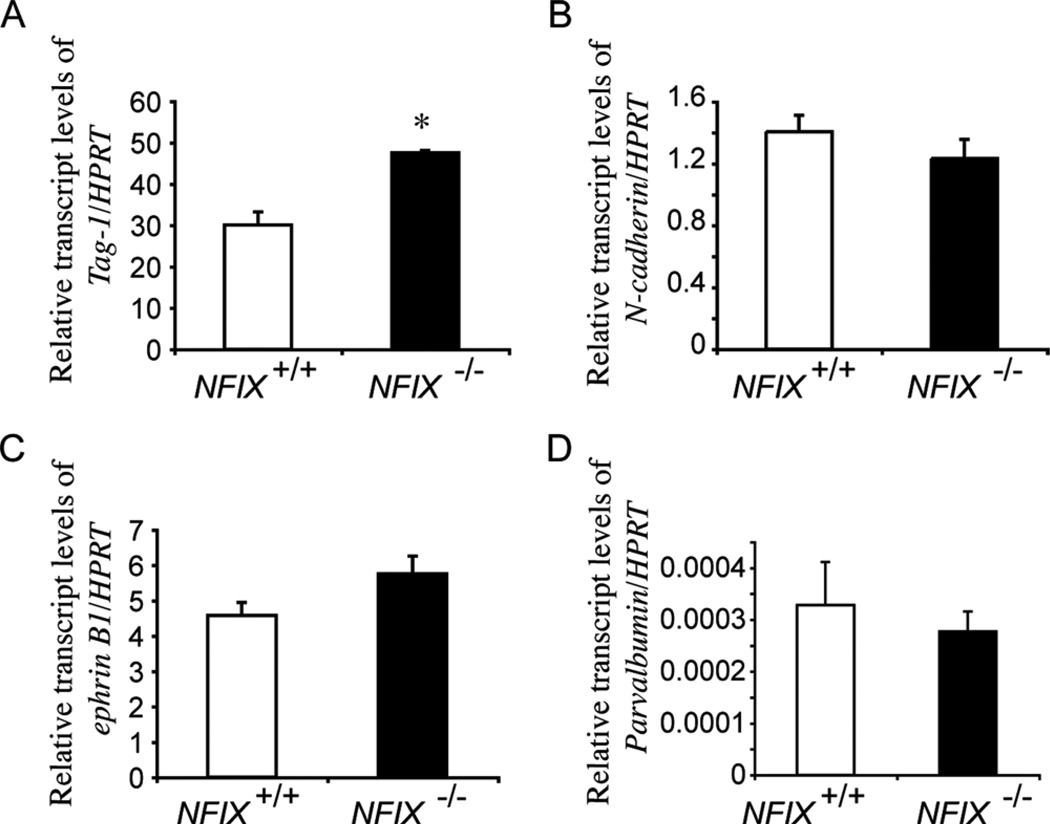
Figure 11.
qPCR analysis of P5 wild-type and NFIX−/− cerebellar tissue. qPCR on P5 cerebellar tissue revealed a significant increase in Tag-1 mRNA in the NFIX−/− mutant compared with controls (A). Levels of N-cadherin (B), ephrin B1 (C), and parvalbumin (D) were not significantly different between controls and NFIX−/− mice. *P < 0.05, t-test.

