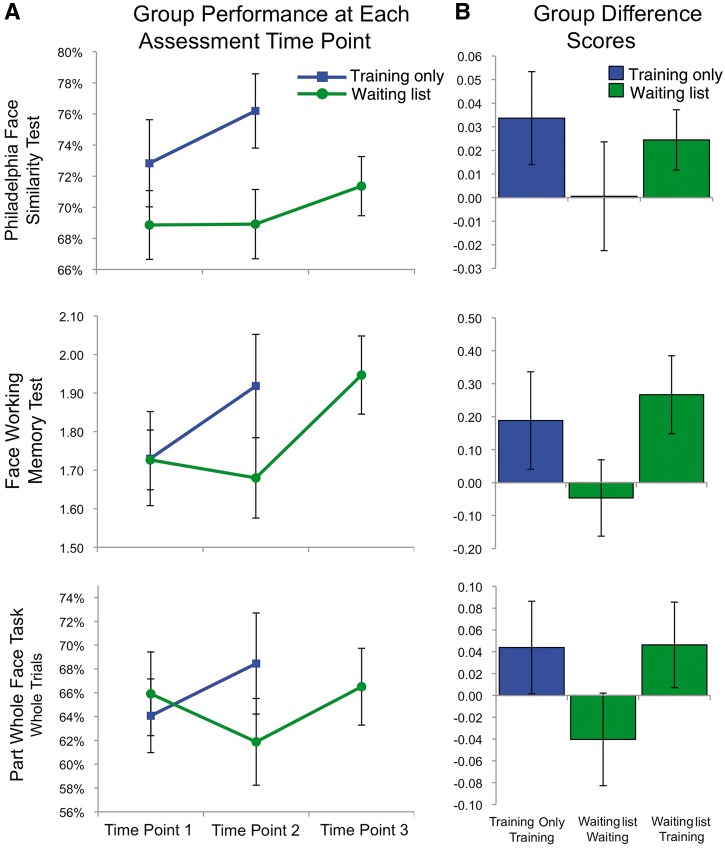
Figure 5.
(A) Scores for the training only (blue) and the waiting list (green) groups on the three front-view face perception tests. Time point 1 indicates before training/waiting for both groups. Time point 2 is after training for the training only group, and after waiting for the waiting list group. Time point 3 is after training for the waiting list group. Error bars indicate the standard error of the mean. (B) Group difference scores on the three front-view face perception tests for training only group (time point 2 − 1), waiting list waiting period (time point 2 − 1), and waiting list training period (time point 3 − 2). Error bars indicate the standard error of the difference scores.

