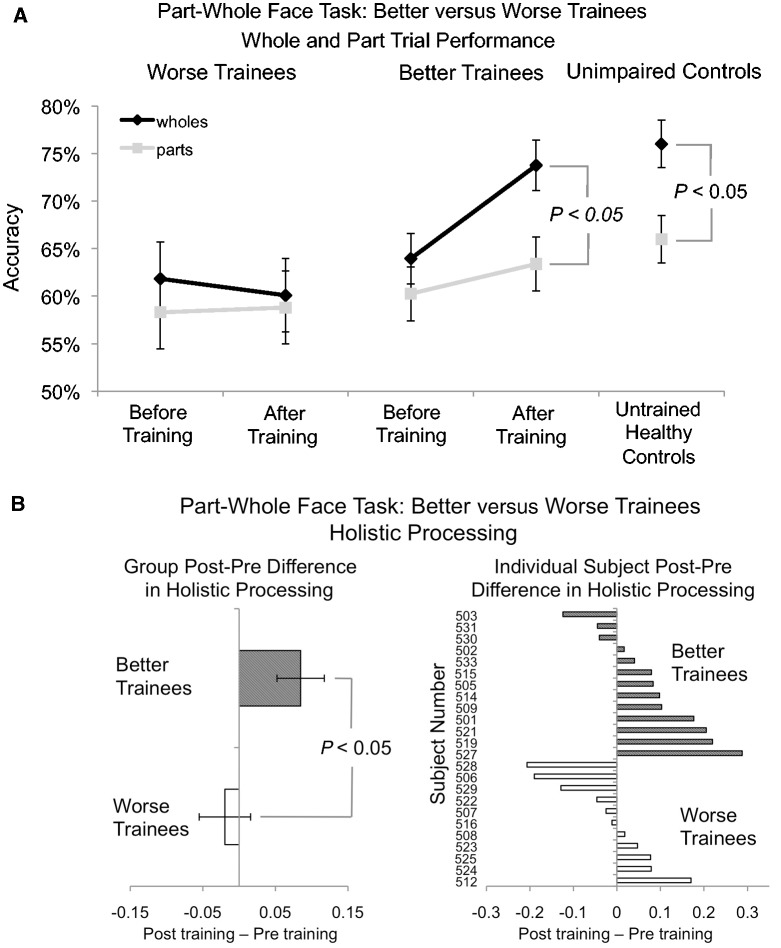
Figure 6.
(A) Whole (black) and part (grey) trial accuracy for better and worse trainees before and after training compared to unimpaired controls. Error bars indicate the standard error of the mean for each condition. (B) Holistic processing measured by regression for better and worse trainees before and after training. Error bars indicate the standard error of the post minus pretraining difference scores.

