
Figure 4.
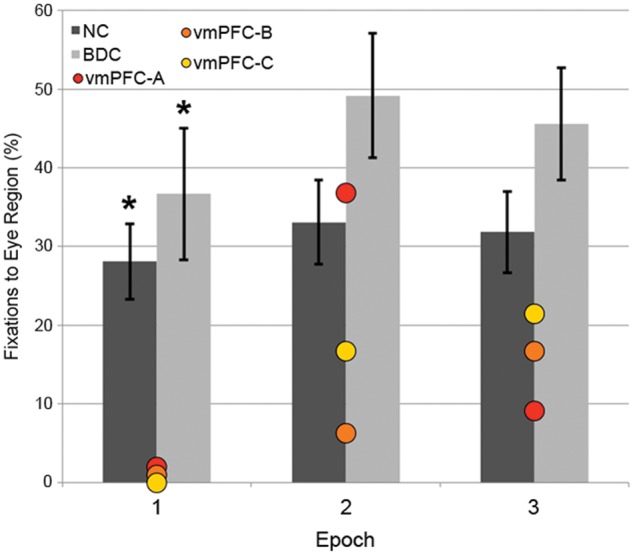
Eye tracking results in 1-s time bins. Percentage of fixations to the eye area of fearful faces during each 1-s epoch of the trial, with ventromedial PFC (vmPFC) patients plotted individually. Red: vmPFC-A, orange: vmPFC-B, yellow: vmPFC-C. Error bars indicate standard error of the mean. Differences from ventromedial PFC group: *P < 0.05. BDC = brain-damaged comparison.