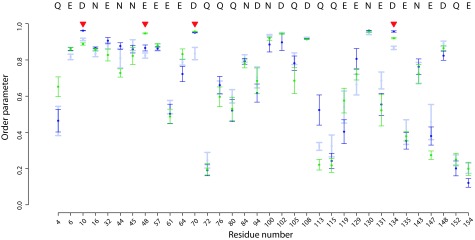
Figure 6. Differences in DENQ sidechain S 2 values in the presence of Mg 2+ ions in ecRNH.

Calculated S 2 values are shown for various simulation conditions with standard errors of the mean: ecRNH apo (light blue), A site (dark blue), B site (green). The four active-site residues are indicated with red triangles. In no case does the difference between any two simulations reach statistical significance.
