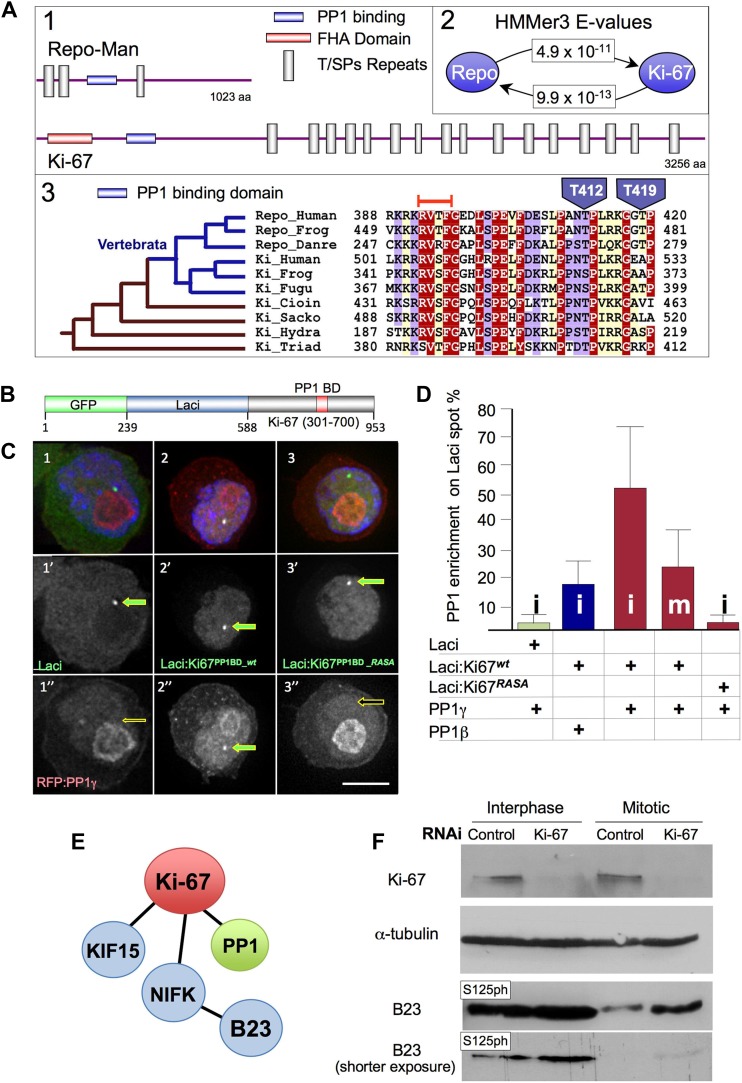
Figure 1. Ki-67 is evolutionary related to Repo-Man but shows distinct behaviour during mitosis.
(A1) Schematic representations of evolutionarily conserved regions in human Repo-Man and Ki-67 proteins (shown approximately to scale). (A2) E-values corresponding to global profile-to-sequence (HMMer3) comparisons between the PP1 binding conserved regions (blue oval) in Repo-Man and Ki-67 families. Arrows indicate the profile search direction. The Repo-Man profile identified Ki-67 proteins as homologous with a highly significant E-value of 4.9 × 10⁻¹¹. Conversely, the profile of Ki-67 homologous sequences in animals identified Repo-Man proteins with a significant E-value of 9.9 × 10⁻¹³. (A3) Representative multiple sequence alignment of conserved regions from Repo-Man and Ki-67 families. Important mitotic phospho-residues in Repo-Man (T412 and T419) are indicated in blue. The RVTF motif is indicated with an orange box. The most parsimonious explanation of Repo-Man and Ki-67 evolution is shown to the left of the alignment. Vertebrate branches are coloured in blue. Sequences are named according to: Repo_Human, NCBI:NP_689775, Homo sapiens; Repo_Frog, NCBI:ACR33033, Xenopus laevis; Repo_Danre, UniProt:A2CEF0, Danio rerio; Ki_Human, UniProt:P46013, Homo sapiens; Ki_Frog, UniProt:Q0VA85, Xenopus laevis; Ki_Fugu, UniProt:UPI00016EA029, Takifugu rubripes; Ki_Cioin, UniProt:UPI000180CFDA, Ciona intestinalis; Ki_Sacko, Baylor College of Medicine genome and FGENESH+, Saccoglossus kowalevskii; Ki_Hydra, UniProt:UPI0001926DD5, Hydra magnipapillata; and, Ki_Triad, UniProt:B3SB24, Trichoplax adhaerens. The amino acid colouring scheme indicates average BLOSUM62 scores (which are correlated with amino acid conservation) for each alignment column: red (greater than 3.5), violet (between 3.5 and 2.5), and light yellow (between 2.5 and 0.5). (B–C) Ki-67 and PP1γ interact in vivo. Ki-67301–700 fused to Lac repressor:GFP (Lac repressor:Ki-67PP1BD_wt) was transfected together with RFP:PP1γ into a DT40 cell line containing a LacO array integrated on a single chromosome. Ki-67 was enriched at the LacO site (panels 2, 2′) where it recruited PP1γ (2, 2″). However, neither Lac repressor:GFP (panels 1–1″) or the Ki-67 PP1-non-binding mutant (Lac repressor:Ki-67PP1BD_RASA) (panels 3–3″) caused PP1 accumulation at the LacO site. (D) Ki-67 recruits PP1γ more efficiently than PP1beta and more efficiently in interphase than in mitosis. The experimental set up was as in (B). The enrichment of PP1 signal at the Lac repressor spot was compared to the background nuclear (interphase) or cytoplasmic (mitosis) signal within the same cell. Scale bar 10 μm. (E) Direct and indirect interactors of Ki-67. (F) The B23S125 phosphorylation level remains high in Ki-67 depleted mitotic cells. Immunoblots of whole cell extracts of cycling (interphase) of Nocodazole-arrested (mitotic) HeLa cells transfected with Ki-67 RNAi oligo 5 or control oligos, were probed for Ki-67, tubulin, B23T199ph, and B23S125ph. Two exposures of the B23S125ph blot are shown.


