. 2014 May 27;3:e01641. doi: 10.7554/eLife.01641

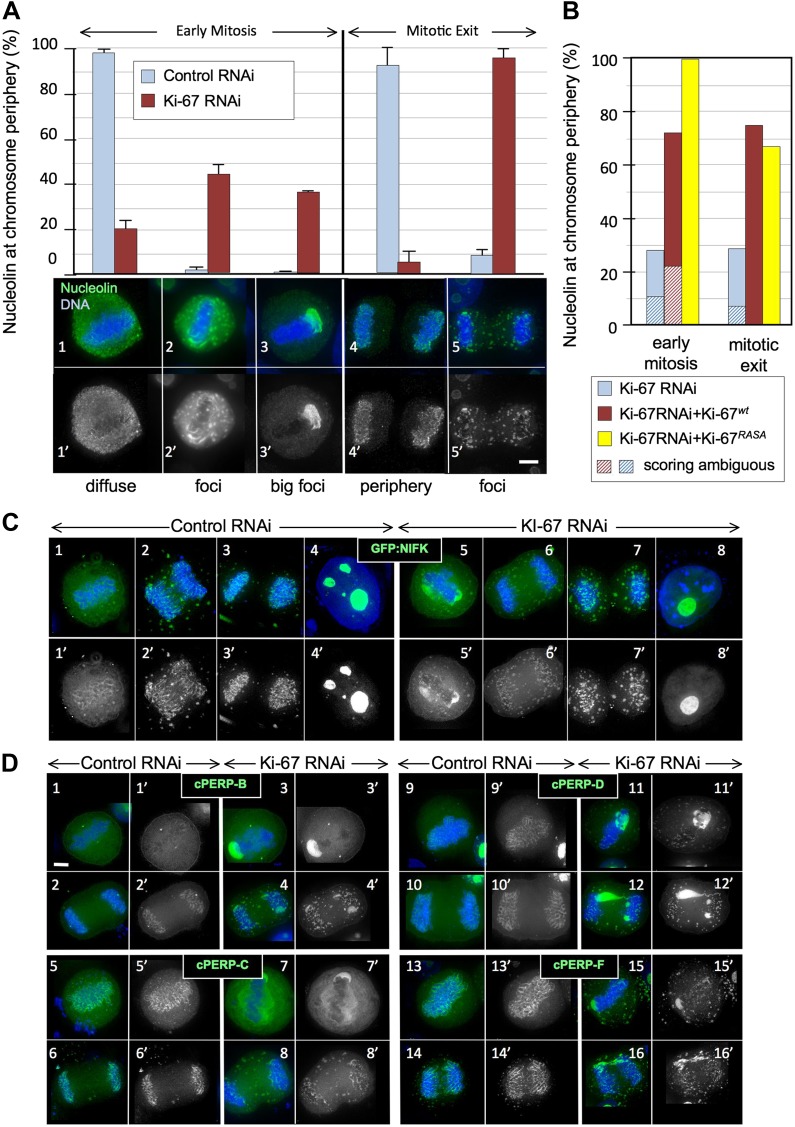
Figure 2. Ki-67 is required for targeting of nucleolar proteins to the chromosome periphery in mitosis.

(A) Localisation of endogenous nucleolin is aberrant in mitotic cells after Ki-67 depletion (panels 2, 3, 5). HeLa cells were transfected with Ki-67 RNAi oligo 5 (panels 2, 3, 5) or control oligos (panels 1, 4) and stained for nucleolin (green). Quantification of the phenotypes is indicated in the graph above the corresponding representative images. Scale bar 5 μm. (B) RNAi rescue experiment. HeLa cells depleted of Ki-67 were transfected with either mCherry:Ki-67wt, or mCherry:Ki-67RASA, together with Ki-67 RNAi oligo 5 or control oligo and stained for nucleolin. The localisation of nucleolin in mitotic cells was quantified in the different experimental conditions. See Figure 2—figure supplement 1 for representative images. Scale bar 10 μm. (C) The mitotic chromosome peripheral localisation of NIFK is disrupted upon Ki-67 RNAi (panels 5–6). HeLa cells were transfected with GFP:NIFK (green) and oligo 5 (panels 5–8) or control oligo (panels 1–4). Scale bar 10 μm. (D) All novel cPERPs tested failed to accumulate on the chromosome periphery in mitosis. HeLa cells were co-transfected with GFP:cPERPs identified in an earlier study (Ohta et al., 2010) (green) and oligo 5 (panels 3–4, 7–8, 11–12, 15–16) or control oligo (panels 1–2, 5–6, 9–10, 13–14): GFP:cPERP-B (panels 1–4), GFP:cPERP-C (panels 5–8), GFP:cPERP-D (panels 9–12), GFP:cPERP-F (panels 13–16). Scale bar 5 μm.

DOI: http://dx.doi.org/10.7554/eLife.01641.006

Figure 2.

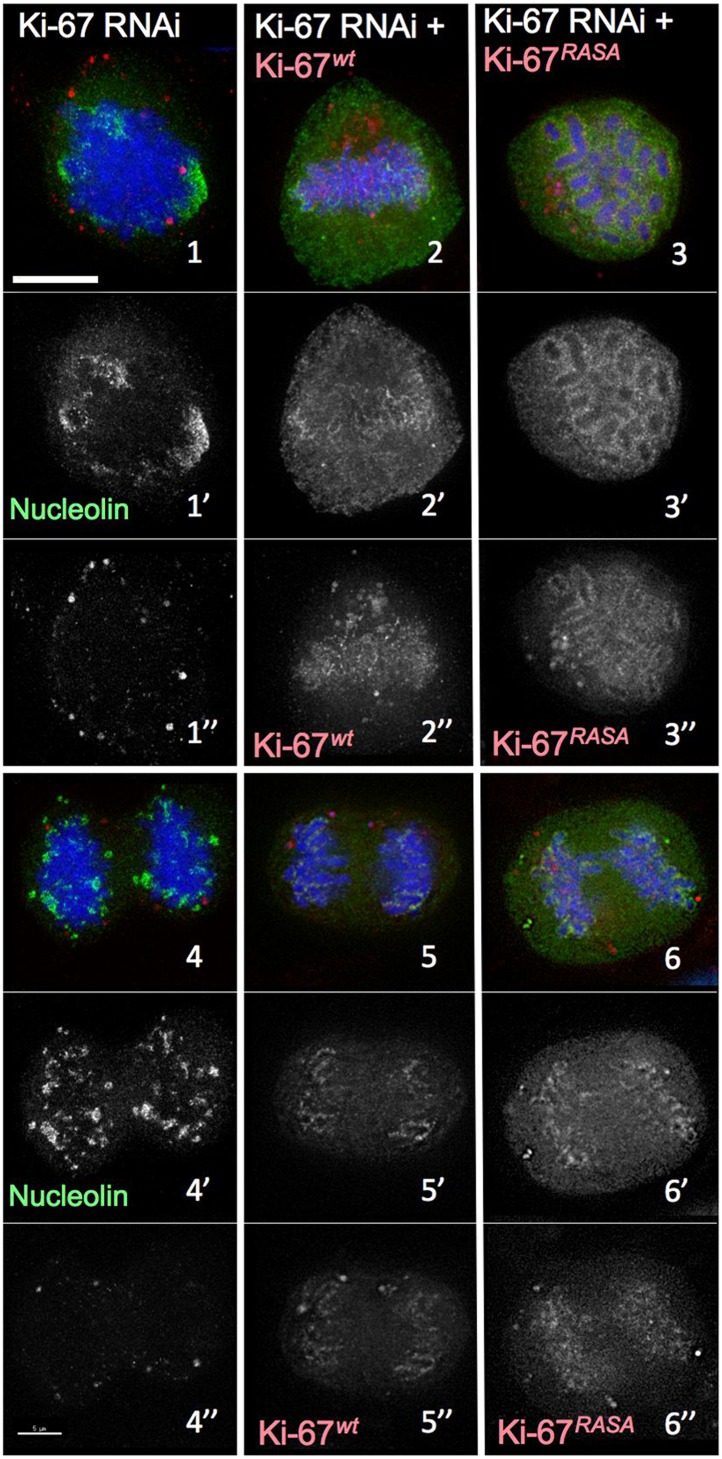
Figure 2—figure supplement 1. Distribution of nucleolin in mitosis following exposure of cells to different Ki-67 siRNA oligonucleotides with and without rescue by Ki-67 cDNA.

Figure 2—figure supplement 1.

RNAi rescue experiment. Representative microscopy images for quantifications shown in Figure 2B. HeLa cells depleted of Ki-67 were transfected with either mCherry:Ki-67wt (panels 2, 5) or mCherry:Ki-67RASA (panels 3, 6) (red) together with Ki-67 RNAi oligo 5 (panels 4, 5, 6) or control oligo (panels 1, 2, 3) and stained for nucleolin (green).
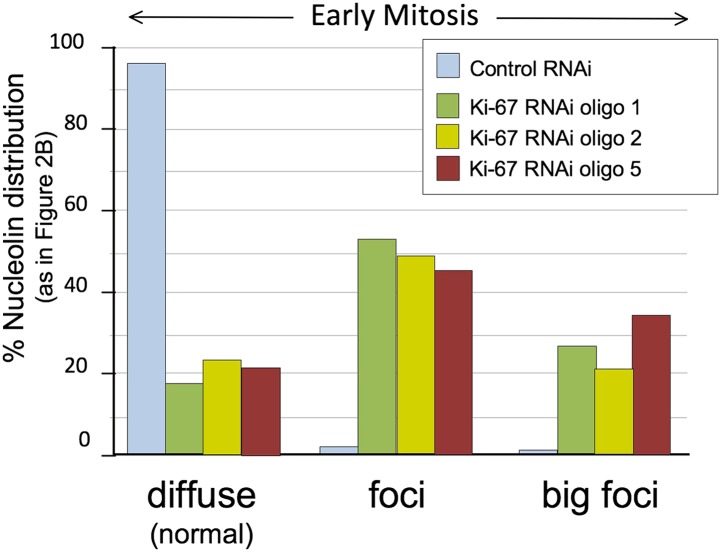
Figure 2—figure supplement 2. Distribution of nucleolin in mitosis following exposure of cells to different Ki-67 siRNA oligonucleotides.

Figure 2—figure supplement 2.

HeLa cells were transfected with Ki-67 RNAi oligo 1, 2 or 5 or control oligos and stained for nucleolin. Nucleolin localisation was classified as for Figure 2B (diffuse, aberrant, and big foci) and the graph represents the quantification of the phenotypes. Scale bar 5 μm. The three different oligos produce the same phenotype.
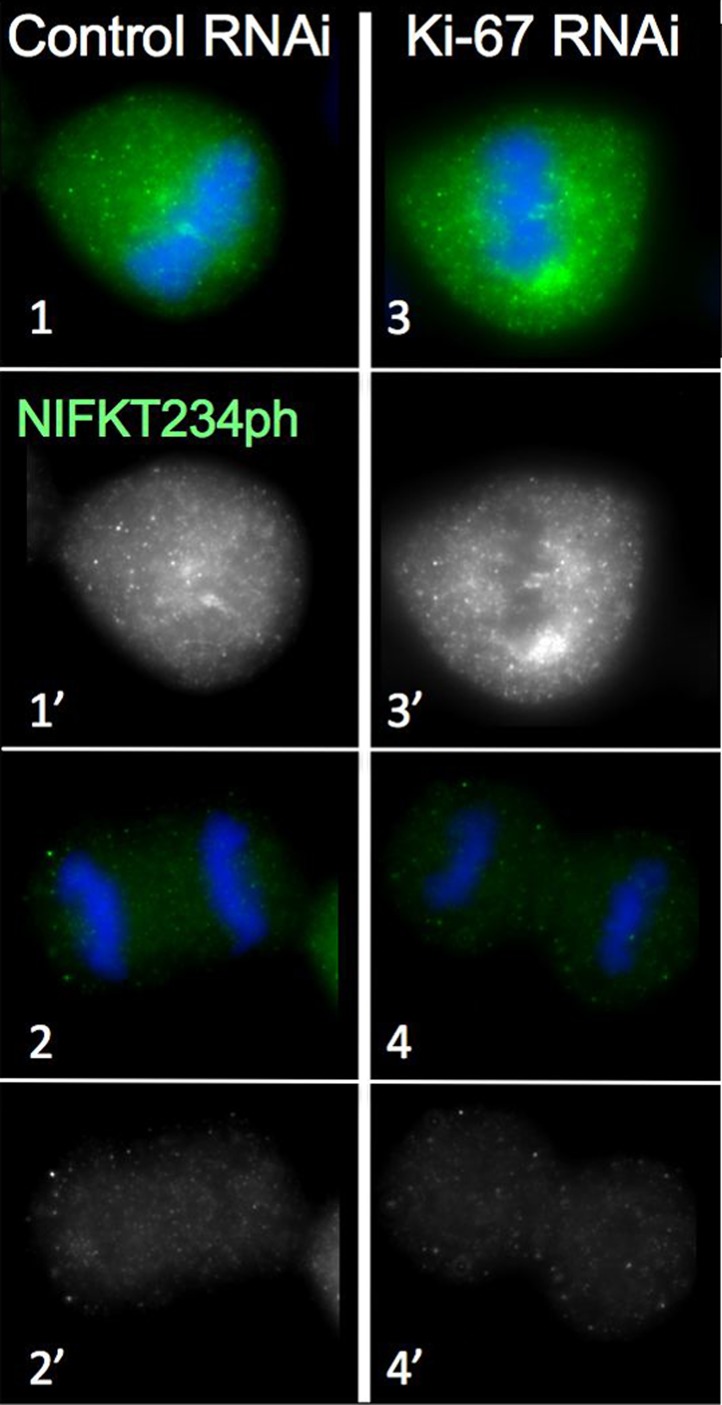
Figure 2—figure supplement 3. Distribution of NIFK in mitosis following Ki-67 depletion.

Figure 2—figure supplement 3.

NIFK T234 phosphorylation is regulated normally in the presence and absence of Ki-67. Hela cells were transfected with Ki-67 RNAi oligo 5 (panels 3, 4) or control oligos (panels 1, 2) and stained with NIFK234ph antibody (green). Scale bar 10 μm.