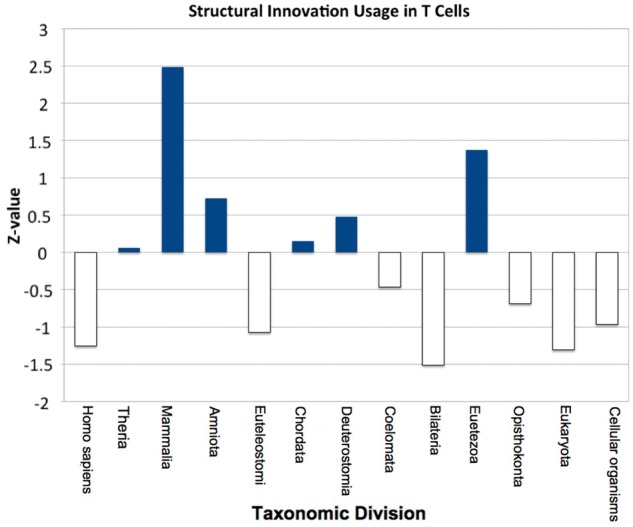
Fig. 3.

The evolutionary profile for T-cells. Blue bars represent greater than average usage of domain architectures appearing at that evolutionary time, with the height of the bar illustrating magnitude of PIU score. The clear bars show below average usage of architectures of such age. For these T-cells: in Eumetezoa, Amniota, and Mammalia, there is a much greater usage of protein innovation. Conversely, they make less than average use of structural innovation between cellular organisms and Opisthokonta as well as at Bilateria, Euteleostomi, and H. sapiens.
