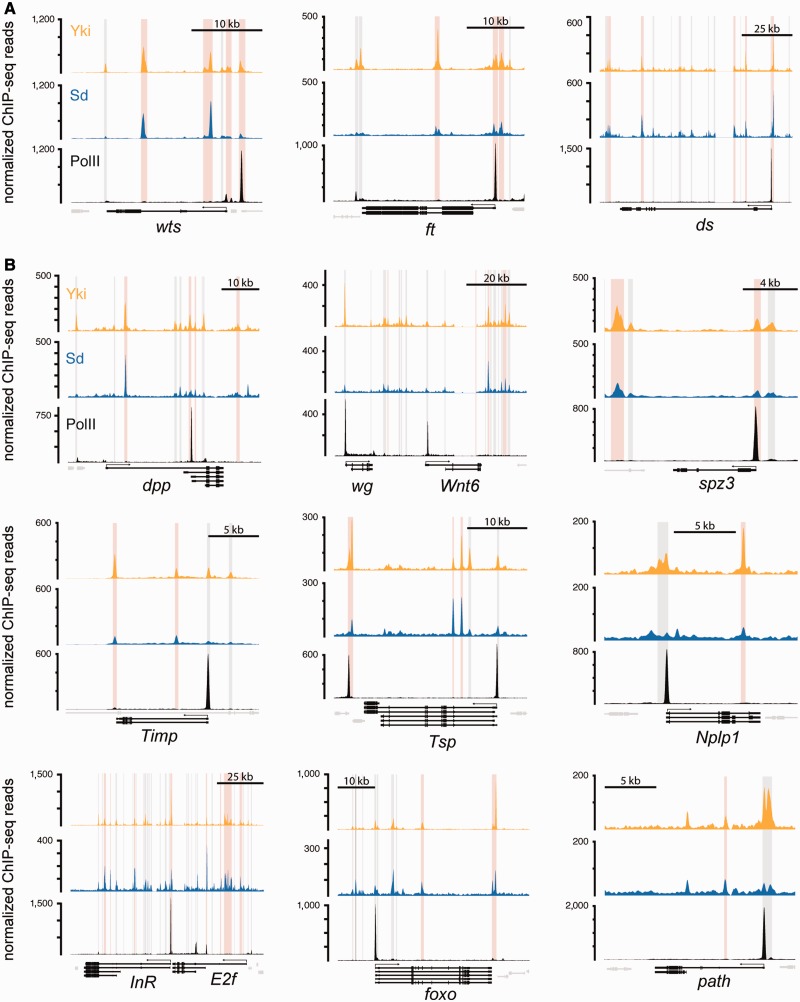
Fig. 6.
Chromatin localization of Yki and Sd on novel target genes. Plots of Yki (orange), Sd (blue), and PolII (black) occupancy peaks in selected commonly upregulated genes from the RNA-seq data. (A) Target genes belonging to novel negative feedback loops. (B) Novel target genes. Transcriptional units of target genes are highlighted in black and their neighbor genes are in gray. Pink and gray bars indicate significant Yki/Sd and Yki peaks, respectively.

