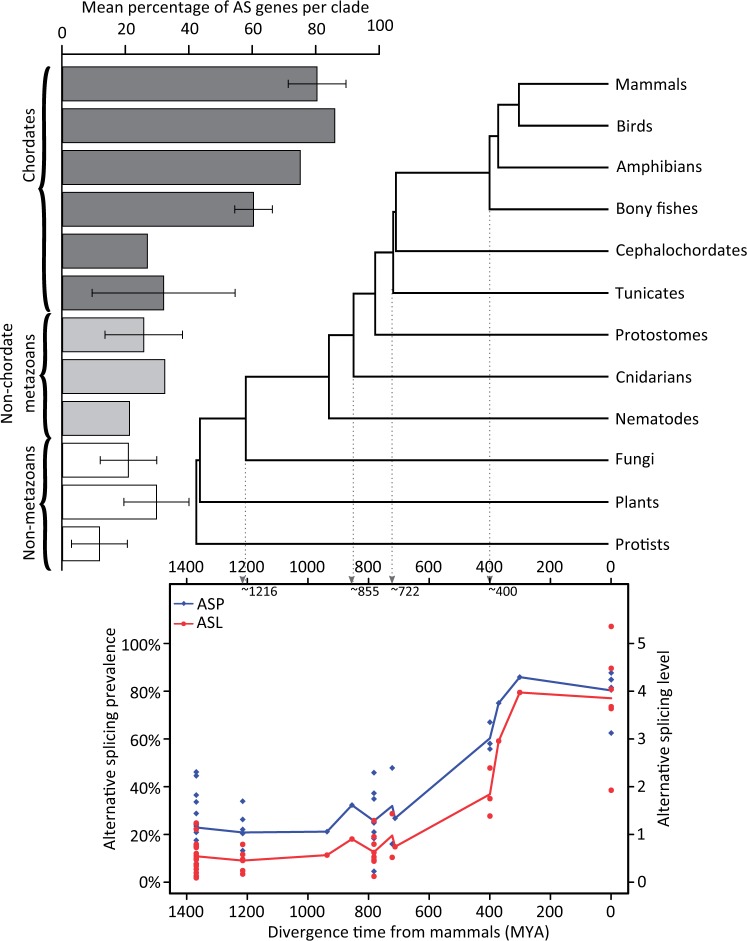
Fig. 1.
Variance in alternative splicing over evolutionary time. Bars show the average percentage of alternatively spliced genes per species grouped according to their divergence from humans, as shown in the adjacent phylogenetic tree (data from Hedges et al. 2006), and their taxonomic category (chordate, nonchordate metazoan, or nonmetazoan). The scatter plot shows changes in alternative splicing prevalance, that is, the percentage of alternatively spliced genes per genome (blue) and in alternative splicing level, that is, the average number of alternative splicing events per gene for each species (red). Trend lines represent the mean of all values at each divergence time. Although the relative positions of cephalochordates and tunicates on this tree are disputed (Delsuc et al. 2006), this does not significantly alter the trend.

