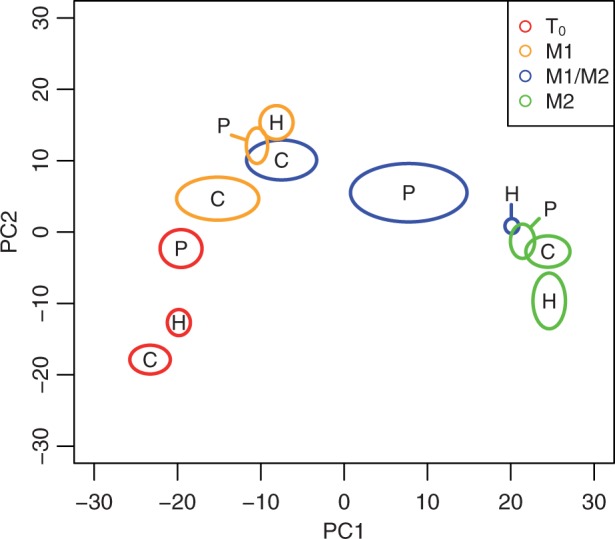
Fig. 2.

Principal coordinate analysis of 352 differentially expressed genes. Ovals show the 95% confidence interval of S. cerevisiae (C), S. paradoxus (P), and hybrid (H) principal coordinates at each meiotic stage and are centered on the mean values. Meiotic stages are T0 (red), M1 (orange), M1/M2 (blue), and M2 (green). The first and second principal coordinate explain 42% and 13% of the variation among samples, respectively.
