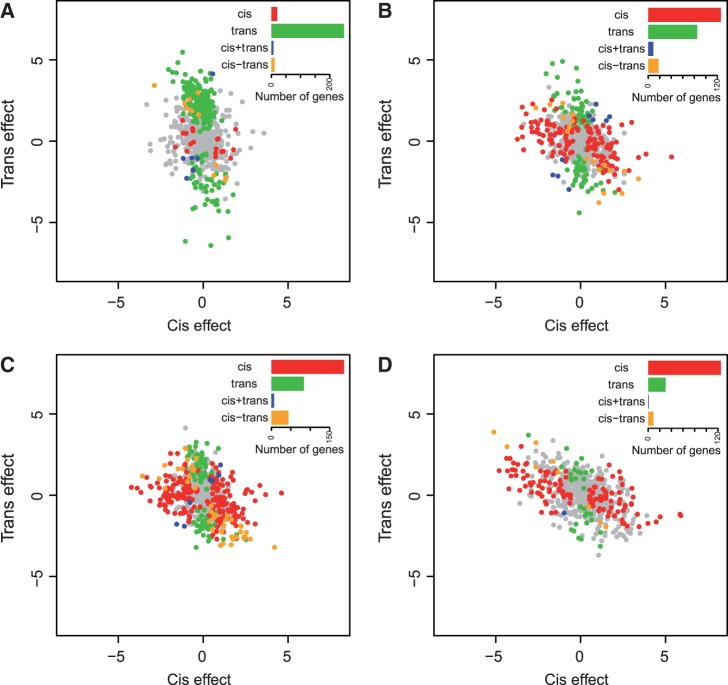
Fig. 4.
Genes classified into different categories of cis- or trans-acting expression differences. Each plot shows the log 2 normalized cis- (x-axis) or trans- (y-axis) effect for the T0 (A), M1 (B), M1/M2 (C), and M2 (D) stages. Each circle shows one of 677 genes that could be classified into four categories of expression divergence, which are: cis-only (red), trans-only (green), cis+trans (blue), and cis-trans (orange). Genes without significant expression differences are shown in gray. Inset within each panel shows the number of genes classified into each category.

